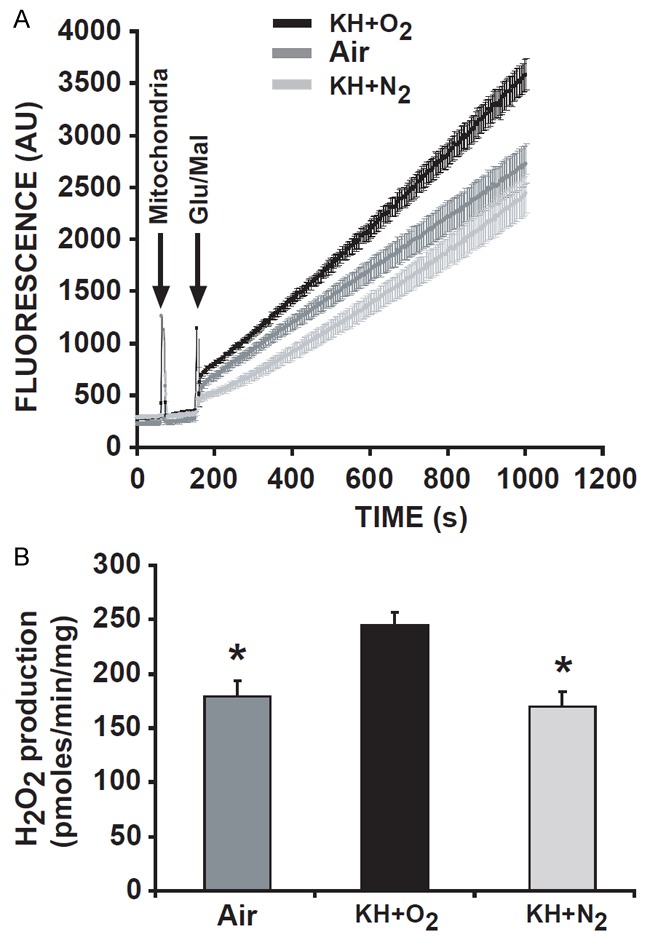
Figure 7.

Mitochondrial ROS production was much lower in hearts suspended in air and immersed in KH+N2 than in hearts immersed in KH+O2 during the ischemic period. Graph representing the mean values of the rate of ROS production in mitochondria isolated from hearts suspended in air, immersed in KH+N2, or immersed in KH+O2 during the ischemic period (A), and the bar graph corresponding to H2O2 production in all groups (B). Note that mitochondrial ROS production was much lower in groups of hearts suspended in air than in hearts immersed in KH+O2 during the ischemic period. In addition, mitochondrial ROS production was significantly reduced when hearts were immersed in KH+N2 compared to hearts immersed in KH+O2. Values are expressed as mean ± SEM; *P<0.05 hearts immersed in KH+O2 versus hearts maintained in air during ischemia; +P<0.05 hearts immersed in KH+O2 versus hearts immersed in KH+N2 during ischemia (n = 9/group).
