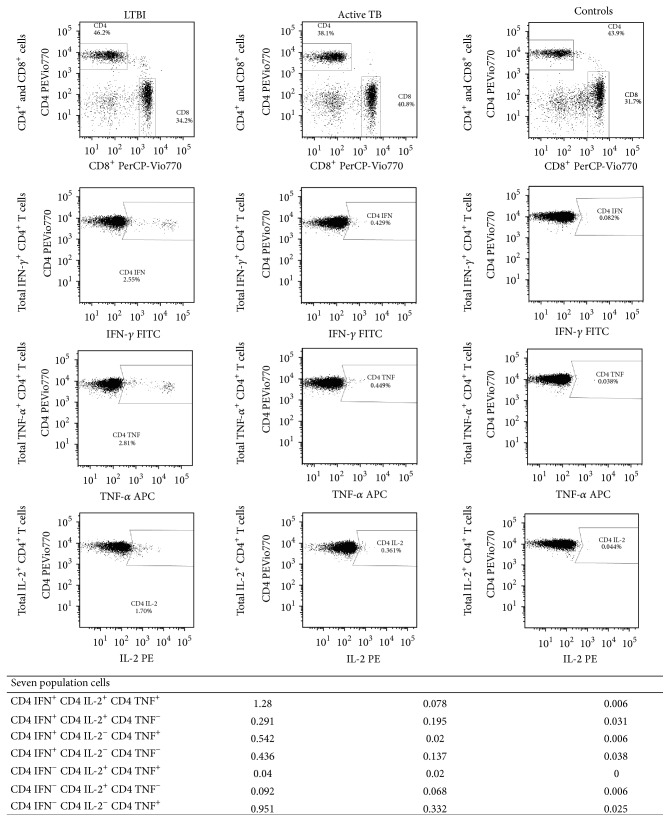
Figure 1.
Representative flow cytometry “combination gates” analysis of CD4+ T cells of LTBI, active TB, and control subject under stimulation of TB antigens. Whole blood was analysed using a gating strategy to exclude debris and to identify CD4+ and CD8+ T cells on CD45+ lymphocytes. The subsequent analysis was on CD4+ gate to describe IFN-γ, IL-2, and TNF-α producing T cells. The percentages of the seven different population cells were showed at bottom and were defined in CD4+ cell gate on the basis of total IFN-γ, IL-2, and TNF-α producing cells.

