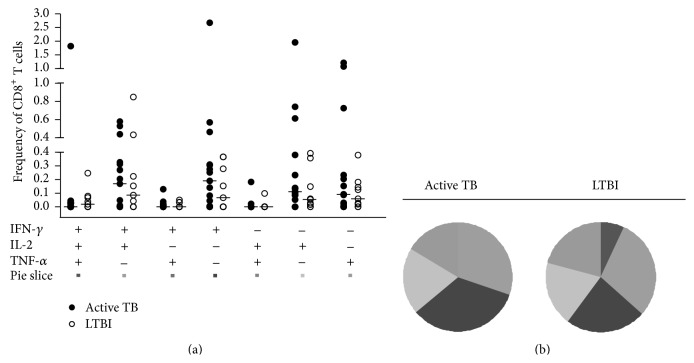
Figure 6.
Multifunctional cytokine analysis of Mtb-specific CD8+ T cells. (a) Frequency of Mtb-specific CD8+ T cells producing all combinations of IFN-γ, IL-2, and TNF-α in active TB patients (n = 18, black circles) and in LTBI patients (n = 10, white circles). Horizontal bars represent the median values. Statistical analysis was performed using Mann-Whitney test. (b) Pie charts represent the relative proportions of cytokine-producing T-cell subsets in each group after Mtb-specific stimulation. A key to colours used in the pie charts is shown at the bottom of the panel (a).

