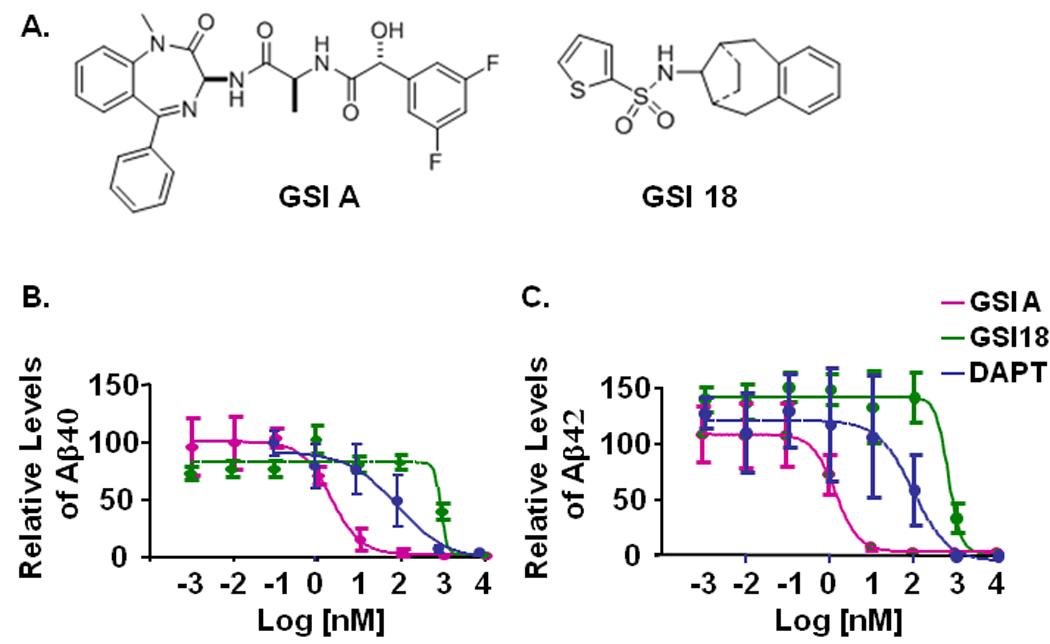
Fig. 1. The structures of GSI A and GSI 18 and an inhibition of γ-secretase cleavage of APP.

A. The structures of GSI A and GSI 18. B. An APP overexpressing CHO cell line 7W was treated with individual compounds and the levels of secreted Aβ in the media were measured by ELISA. Levels of Aβ in the media of 7W cells that were treated with 0.1% DMSO were normalized to 100% and used to calculate the relative levels of Aβ40 (left panel) and Aβ42 (right panel) from cells treated with GSI A, GSI 18, or DAPT. Standard errors of means are illustrated by bars.
