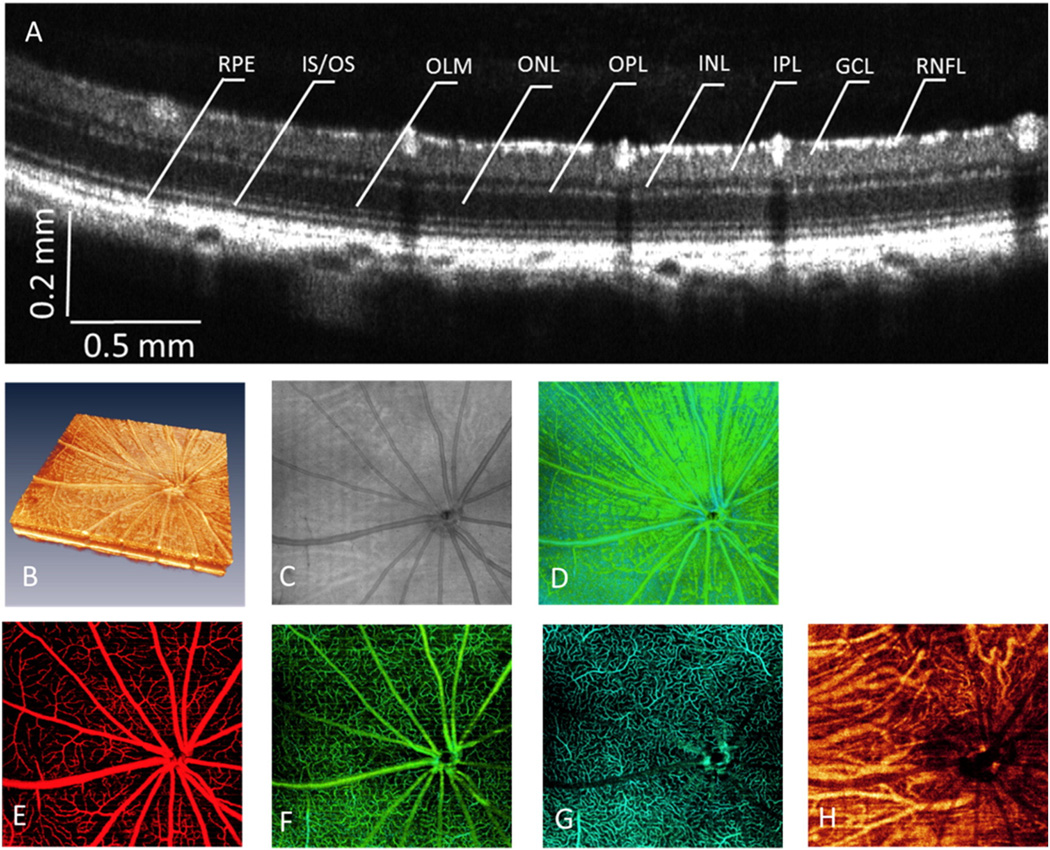
Fig. 2.
Details of the rat retina visualized by OMAG/OCT. (A) Cross-sectional OCT structure image, illustrating all the retinal layers, NFL: nerve fiber layer, GCL: ganglion cell layer, IPL: inner plexiform layer, INL: inner nuclear layer, OPL: outer plexiform layer, ONL: outer nuclear layer, OLM: outer limiting membrane, IS/OS: inner/outer segment, RPE: retinal pigment epithelium. (B) 3D volume rendering of the retina structure. (C) OCT fundus image. (D) Projection view of NFL, showing the nerve fiber bundles. (E–H) Depth-resolved detailed microangiogram with OMAG, showing microvasculature/capillaries within NFL/GCL (E), capillary network within IPL (F), capillary network within OPL (G), and vasculature within choroid (H).

