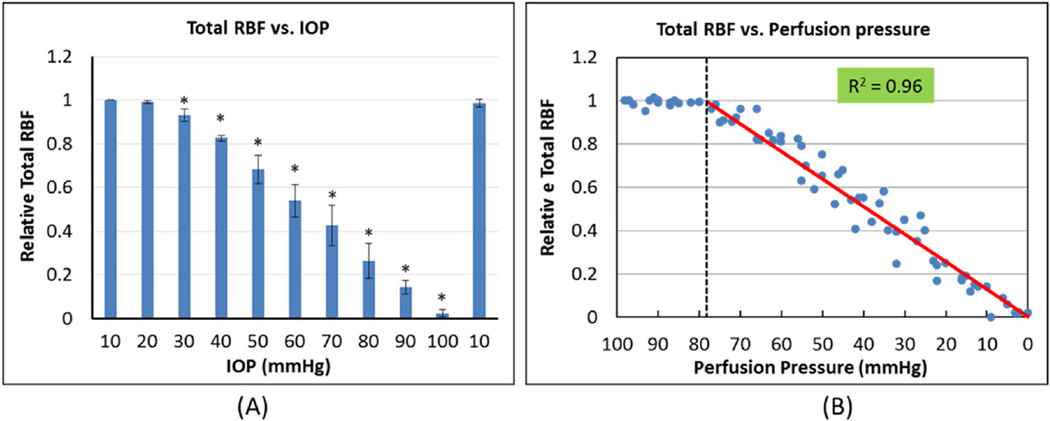
Fig. 7.
(A) Total RBF decreases with the increase of IOP, beginning at 30 mm Hg (* indicates significant change compared to prior IOP level). Data are shown as mean ± SD (N = 7). (B) Change in total RBF with the decrease of ocular perfusion pressure shows a linear decrease once perfusion pressure falls below 80 mm Hg (left of the dashed vertical line). Red line indicates linear fit of individual data points.

