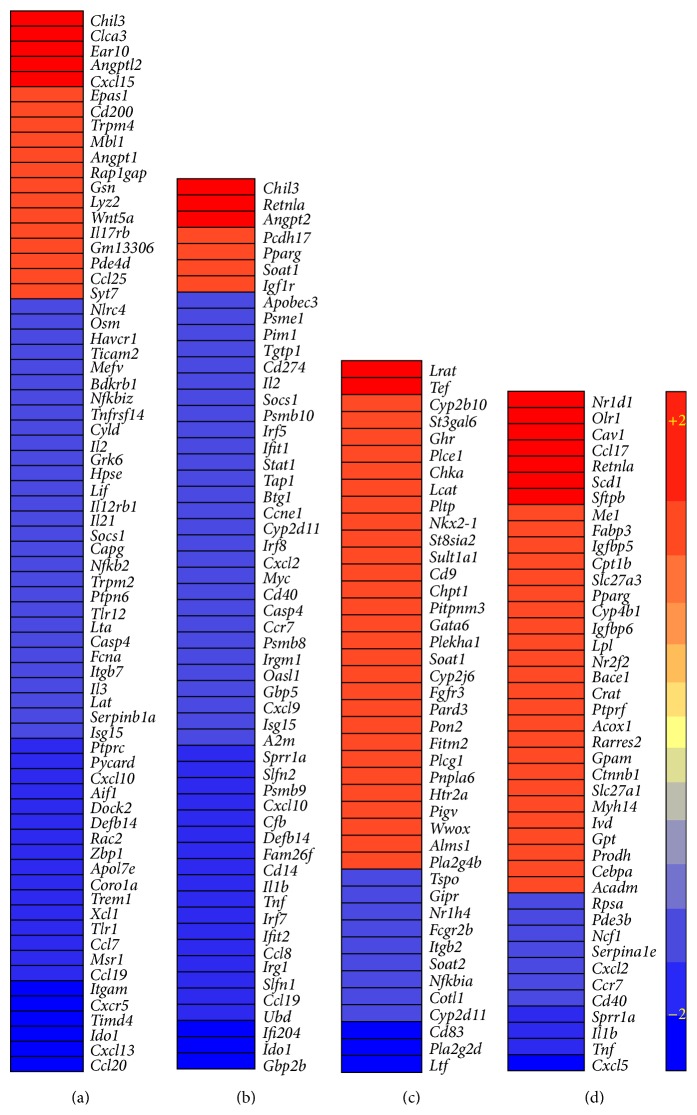
Figure 4.
Intensity plot of network genes differentially expressed in the vaccinated and Mtb-infected mice lungs. (a) Intensity plot of significantly differentially expressed genes involved in the inflammatory response network. (b) Intensity plot of significantly differentially expressed genes involved in the STAT-1 regulon network. (c) Intensity plot of significantly differentially expressed genes involved in the PC metabolism network. (d) Intensity plot of significantly differentially expressed genes involved in the PPAR-γ regulon network. The values plotted in (a)–(d) are different in fold change in the ΔbfrB vaccinated, compared to BCG vaccinated, Mtb-infected mice lungs. Upregulated genes are in red and downregulated genes are in blue. The color scale bar ranges from +2 (red) to −2 (blue).

