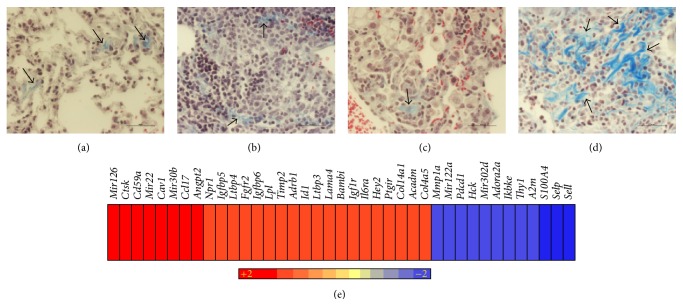
Figure 5.
Fibrosis in the lungs of vaccinated and uninfected or Mtb-infected mice. ((a)-(b)) Masson's trichrome stained lung section of BCG vaccinated (for 8 weeks) and uninfected (a) or Mtb-infected (b) mice. ((c)-(d)) Masson's trichrome stained lung section of ΔbfrB vaccinated (for 8 weeks) and uninfected (c) or Mtb-infected (d) mice. The arrows in (a) and (c) show basal level of fibrosis (blue color). The arrows in (b) show minimal fibrosis in the BCG vaccinated and Mtb-infected mice. The arrows in (d) show extensive fibrosis in the ΔbfrB vaccinated and Mtb-infected mice. Magnification: 4x ((a) and (c)) or 40x ((b) and (d)). (e) Intensity plot of significantly differentially expressed genes involved in the fibrosis network. The values plotted are the difference in fold change in the ΔbfrB vaccinated, compared to BCG vaccinated, Mtb-infected mice lungs. Upregulated genes are in red and downregulated genes are in blue. The color scale bar ranges from +2 (red) to −2 (blue).

