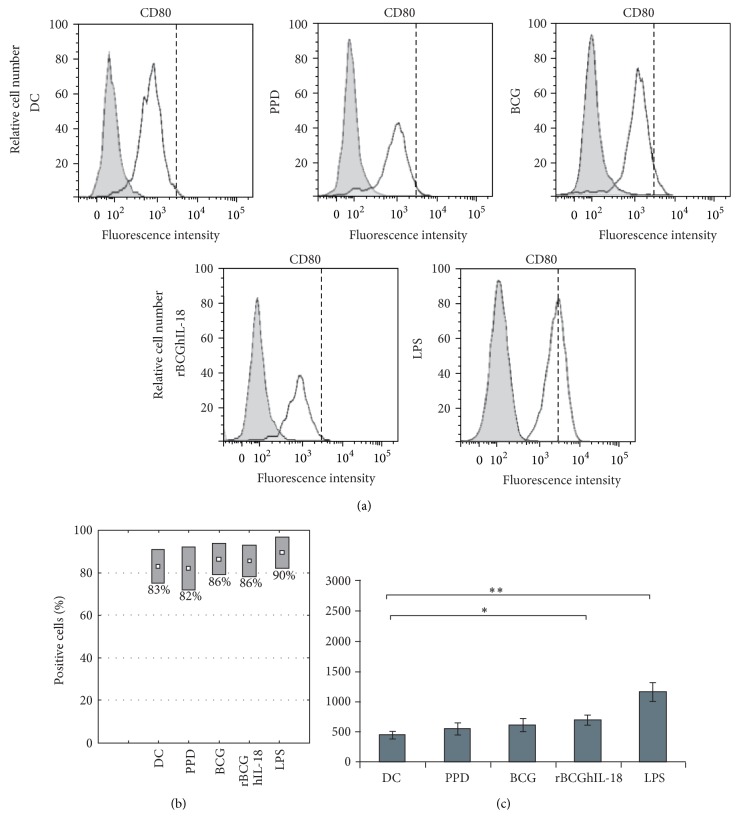
Figure 4.
CD80 surface expression of MoDCs. Human MoDCs were pulsed either with PPD (10 μg/mL), BCG (1 : 1), rBCGhIL-18 (1 : 1), or LPS (1 μg/mL) for 24 h or were left unstimulated (DC). (a) One representative experiment out of 20 independent ones is shown. Grey histograms represent the cell reactivity to fluorochrome-matched isotype control antibodies. The white histograms represent the reactivity with the anti-CD80 antibody. The vertical broken lines represent the upregulation obtained by LPS stimulation; (b) percentage of positive cells with the CD80 expression; (c) median fluorescence intensity (MFI) values (median ± SEM of 20 independent donors). Fluorescence intensity was calculated by the MFI of the receptor expression from which the MFI obtained with a nonrelevant, isotype-matched antibody was substracted. Statistical analyses were performed using the Kruskal-Wallis test. * P < 0.05; ** P < 0.01.

