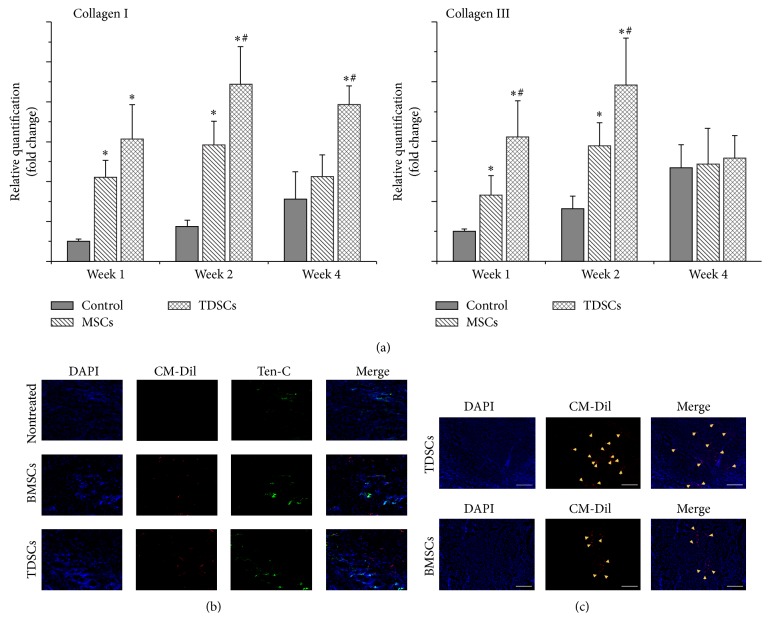
Figure 6.
The analysis of tendon-related ECM expression. (a) Rat-specific gene expression analysis of tendon-related ECM genes: collagen I and collagen III. The gene transcript levels were relative to GAPDH and normalized to nontreated group. * P < 0.05 means compared with the control group, # P < 0.05 means compared with BMSCs group were considered significant (data represents mean ± SD, n = 3). (b) Tenascin-C immunofluorescent testing in the injured Achilles tendon. (c) Cell tracking of TDSCs and BMSCs after transplant at 4 weeks: the nuclei were stained by DAPI (blue spots); the CM-Dil was red spots. Bar: 200 μm.

