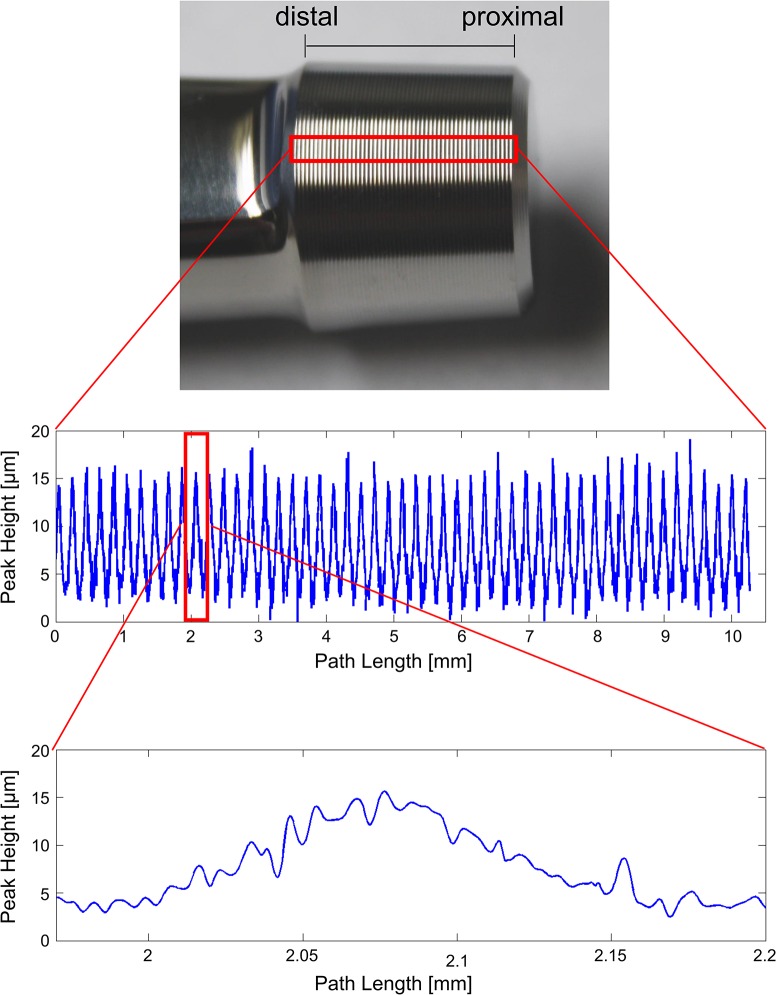
Fig 2. Stem Taper profile.
Multiple measurements of the same stem region (red rectangle, top) were performed. A 100 μm wide path from distal to proximal was chosen to obtain a mean profile (middle). It is noted that each profile ridge demonstrates a surface roughness of about an order of magnitude smaller amplitude and period (bottom).

