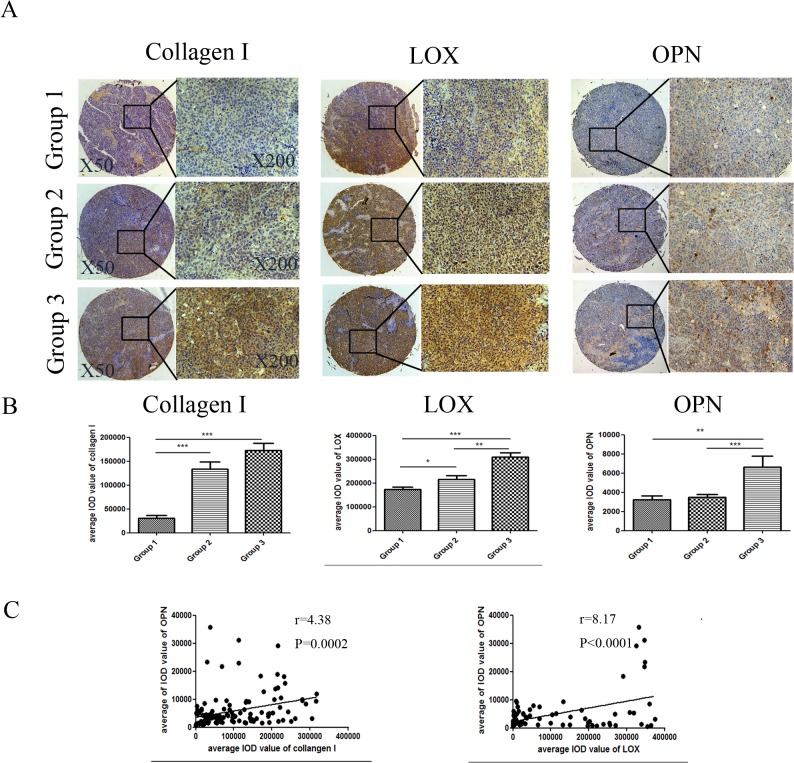
Fig 4. Expressions of COL1, LOX, and OPN in HCC tissue with different matrix stiffness backgrounds.
(A) Representative HCC tumor samples show the expression levels of COL1, LOX and OPN. HCC tissue in Groups 1, 2, and 3 are defined as normal liver stiffness background tissue, medium stiffness and high stiffness liver background tissue, respectively[22]. (B) Graphs showing the average IOD value of COL1, LOX and OPN expression in the three groups analyzed by image pro-plus 6.0 software. In each case, error bars represent SD, *p < 0.05, **p < 0.01, ***p<0.0001. (C) Multiple linear regression indicates that the levels of OPN are positively correlated with the expression levels of LOX and COL1.

