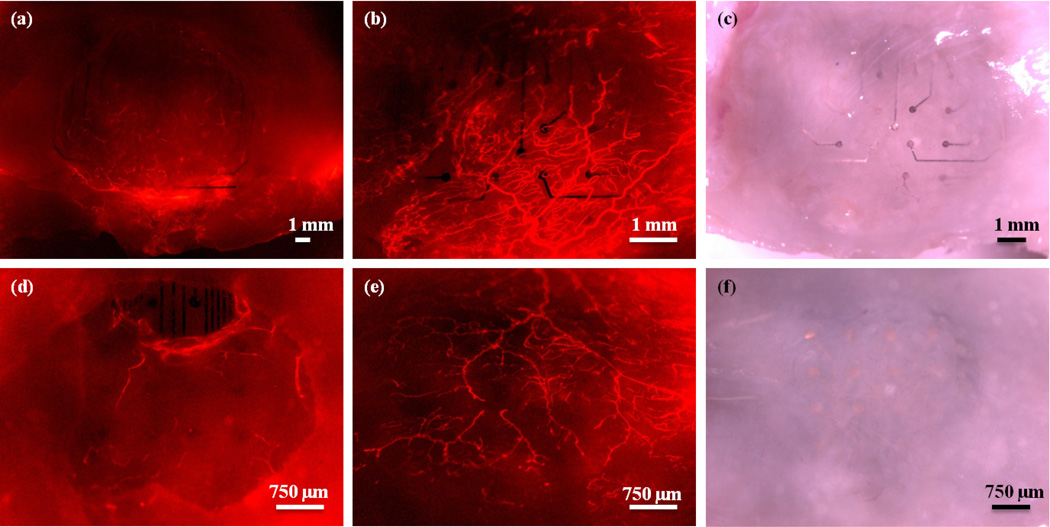
Figure 4.
Electrodes and surrounding tissue in one animal after perfusion with DiI to stain the tissue vasculature. (a) Fluorescence image of the mesh device through the cranial window. (b) Fluorescence image of the underside (the region in contact with the cortex) of the mesh device after brain removal. (c) Bright field image of the underside of the mesh device. (d) Fluorescence image of the solid micro-ECoG device through the cranial window. (e) Fluorescence image of the underside of the solid device after brain removal. (f) Bright field image of the underside of the solid micro-ECoG device. Note that the electrode sites are clearly visible in the images of the underside of the mesh micro-ECoG device, but are difficult to see in the case of the solid device. Animal was perfused 112 days after implantation.

