
Figure 2. FACS analysis of emerging vascular EC progenies from mES and iPS cells.
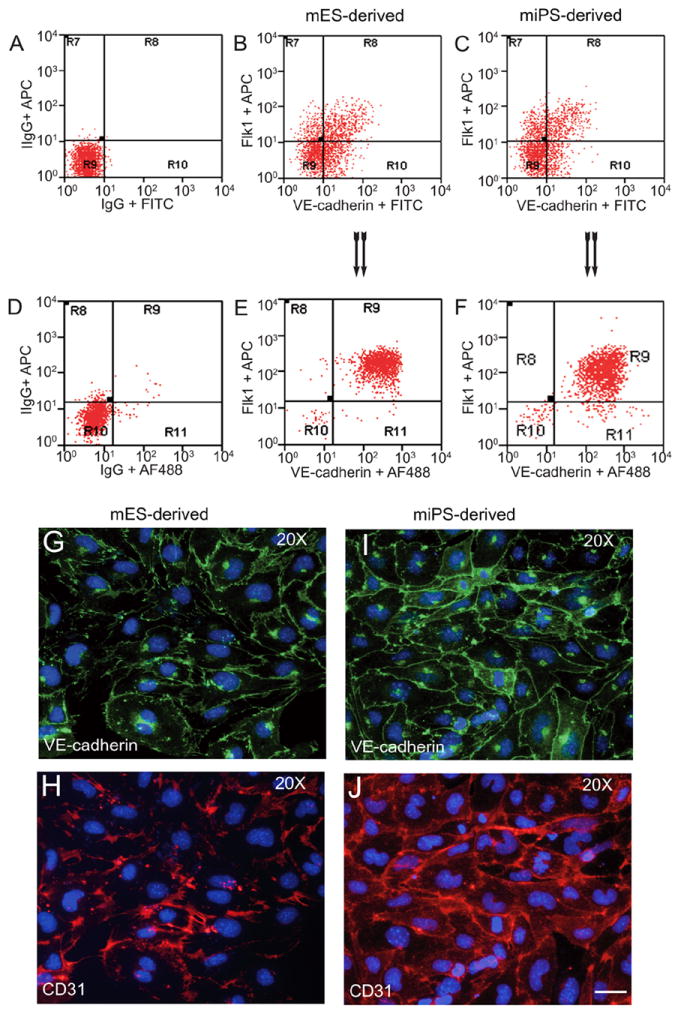
Adherent cells (2×10⁵) were detached and subjected to two-step FACS-aided purification. Control FACS profile on day 5 of cells derived from mES (J1) cells (A). Representative FACS profiles of day 5, with vascular progenies assessed using anti-Flk1 and anti-VE-cadherin antibodies obtained from mES (J1) cells (B) and derived from miPS (iMZ-21) cells (C); Control FACS profile on day 5 of cells derived from miPS (iMZ-21) cells (D). Representative FACS after the second step of purification derived from mES (E) and iPS cells (F). The yield of Flk1+VE-cadherin+ after the second round of FACS was 100% for both mES and miPS-derived vascular progenies. Morphology of mES- and miPS-derived vascular ECs (G-J). Flk1+VE-cadherin+ vascular progenies derived from mES and miPS cells were cultured overnight in IV Col-coated dishes, immunostained with anti-VE-cadherin (green) and anti-CD31 (red) of cells derived from mES cells (G&H) and miPS cells (I&J). DAPI, nucleus (blue). Magnifications are as indicated; the scale bar is 200 μm. Experiments were repeated 3 times. (Reprinted from Kohler EE et al., PloS One 2013 Dec 30;8(12):e85549).