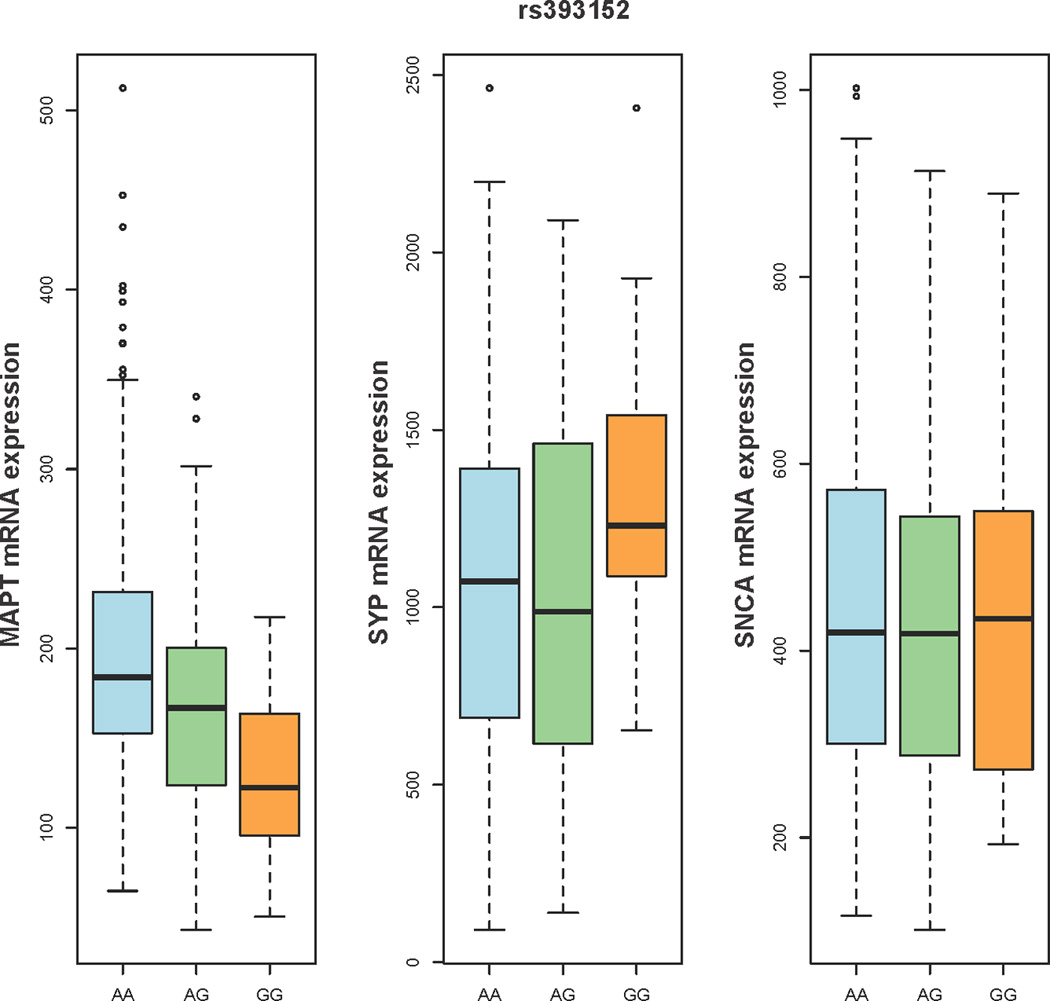
Figure 3.

Box plots illustrating the relationship between rs393152 alleles (x-axis) and gene expression levels of MAPT, SYP, and SNCA (y-axis). For each plot, thick black lines show the median value. Regions above and below the black line show the upper and lower quartiles, respectively. The dashed lines extend to the minimum and maximum values with outliers shown as open circles. For MAPT, a proxy SNP was used (please see Results for additional details). As illustrated, the A allele of rs393152 demonstrated a selective dose-dependent effect on the level of intracranial MAPT transcript.
