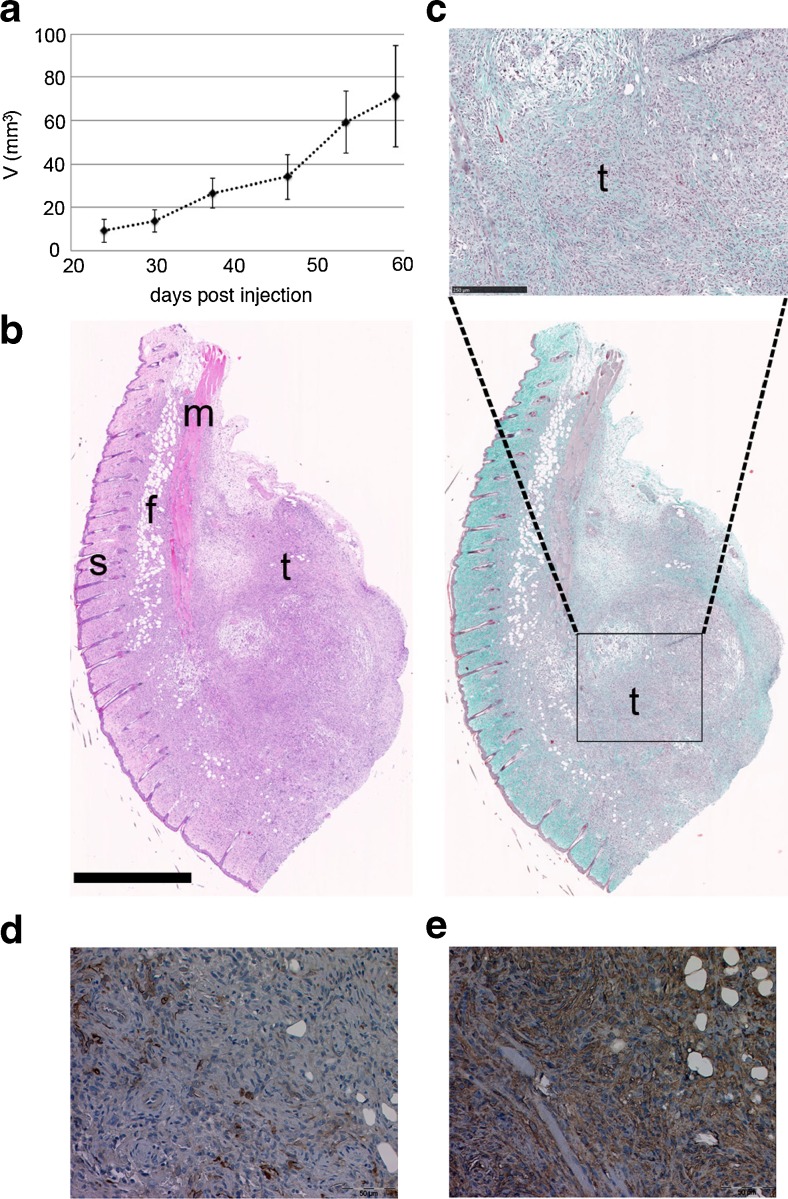
Figure 6.
RN5 subcutaneous xenograft. (a) Xenograft growth monitored weekly 24 d after inoculation (n = 4 mice). (b) Histological sections of the xenograft stained by hematoxylin and eosin (left) and Goldner (right) showing the skin (s), the subcutaneous fat tissue (f), and muscle (m). Scale bar: 1 mm. (c) Magnification emphasizing tumor tissue (t) from the Goldner colored section. Scale bar: 250 μm. Immunohistochemical analysis showed expression of vimentin (d) with strong coexpression of pan-cytokeratin (e) in part of the tumor cell population.

