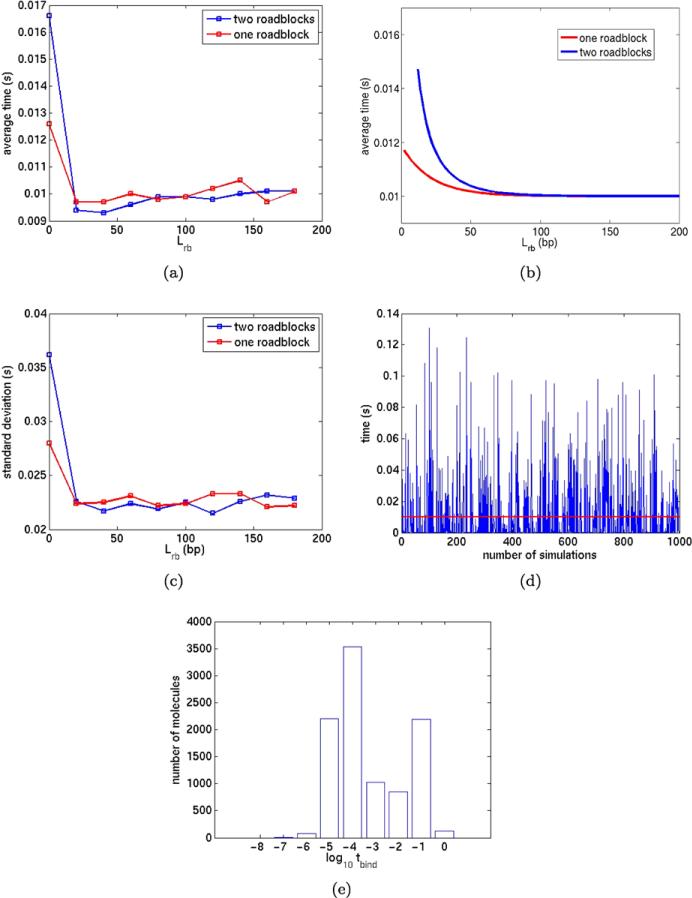
Fig. 14.
(a) The average value of tbind in the mesoscale simulation for two roadblocks (blue) and one roadblock (red) for different distances Lrb. (b) The theoretical value of tbind in Hammar et al. (2012) for two roadblocks (blue) and one roadblock (red) for different distances Lrb. (c) The standard deviation of tbind for two roadblocks (blue) and one roadblock (red) for different distances Lrb. (d) The binding time tbind in 1000 consecutive realizations with Lrb = 120bp (blue) and the average time (red). (e) The histogram of tbind in logarithmic scale in 104 realizations with Lrb = 120bp

