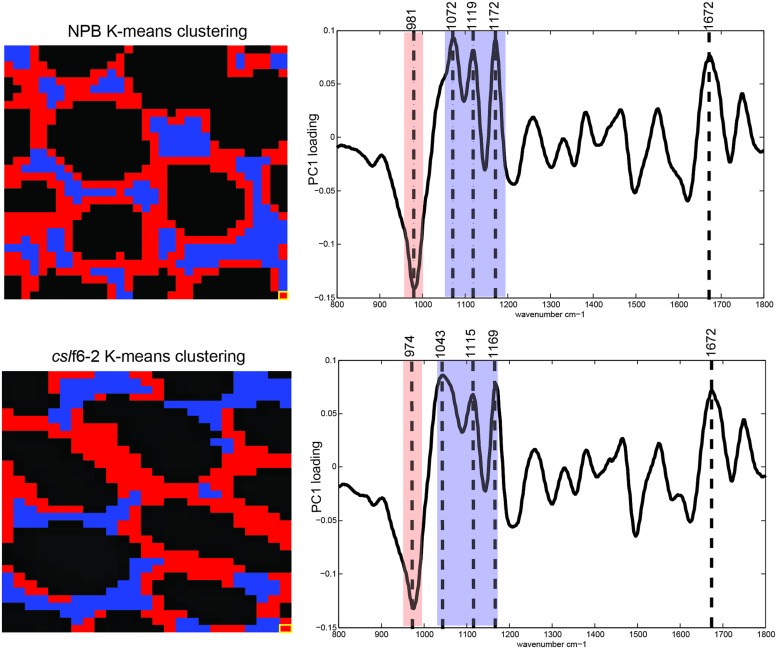
FIGURE 5.
Synchrotron FT-MIR analysis of wild type (NPB) and mutant (cslf6-2) cell walls. Images are representative of three biological replicates for both NPB and cslf6-2. Each pixel (highlighted in yellow at bottom right corner) represents a 3 μm × 3 μm area. K-means clustering of spectra (left) and associated PC loadings (right) are shown. Blue and red pixels and wavenumbers represent cellulose and arabinoxylan spectral signatures, respectively. Note the more random organization of clusters associated with arabinoxylan and cellulose revealing less organization in the mutant, as well as the overall shift of wavenumbers to lower energy states in cslf6-2 compared to wild type.

