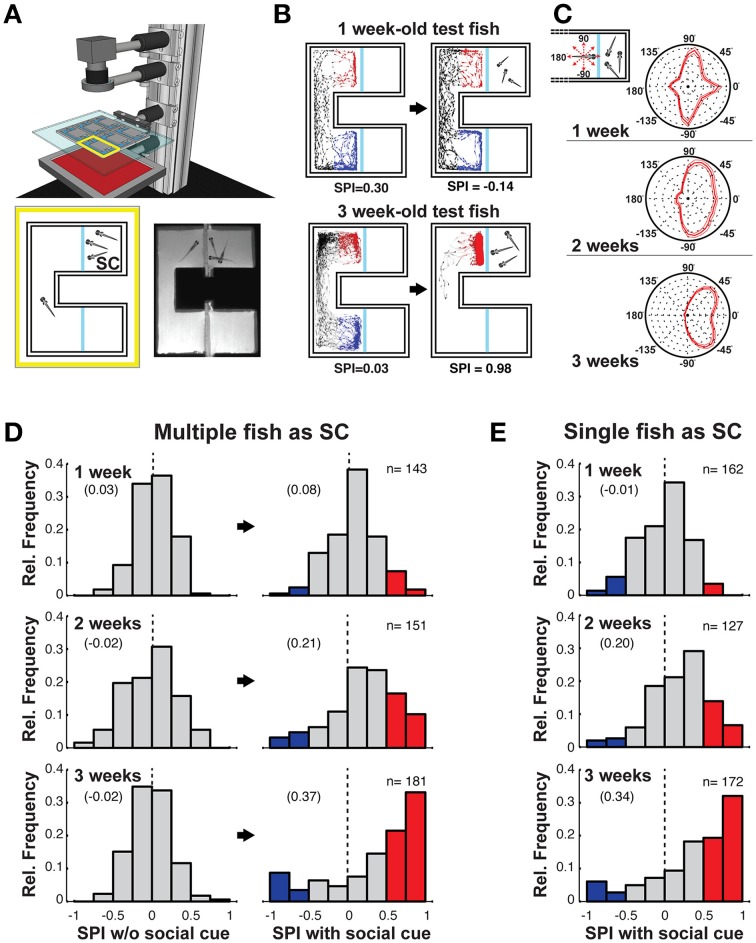
Figure 1.
Social preference is robust in 3 weeks old zebrafish. (A) Schematic of the behavioral setup (top). Infrared light homogeneously illuminates the behavioral arenas. Schematic of a single choice chamber (bottom left) with an observer (test) fish and multiple conspecifics as the social cue (SC). The blue lines are clear glass windows. Single frame from high-speed video recording of an experiment with 3 weeks old fish (bottom right). (B) Examples of tracking of a 1 week old (top) and 3 weeks old (bottom) fish, in the absence (left), and presence (right) of the SC. The blue and red portions of the movement tracks are used to calculate the social preference index (SPI, indicated below). (C) Schematic depicting body orientation of the observer test fish relative to the SC chamber (inset—top left). Polar histograms, averaged across all tested fish, of body orientations of the observer fish when within the SC side of the chamber. From 1 to 3 weeks a preference emerges for the observer fish to view the SC with either the left (−45°) or right (+45°) eye. Thin lines indicate two standard errors from the mean (SEM) (1 week: n = 143, 2 weeks: n = 151, 3 weeks: n = 181). (D) Histograms of all SPIs during acclimation (left column) and SC (right column) periods across different developmental stages [1 week (6–8 dpf); 2 weeks (13–15 dpf), 3 weeks (20–22 dpf)]. A range of positive and negative preferences are observed. For presentation clarity, red bars (SPI > 0.5) highlight strong preference for the SC, while blue bars (SPI < –0.5) highlight strong aversion for the SC (zero is marked with a dashed vertical line). (E) Histogram of all SPIs when a single conspecific served as the SC across different developmental stages. Numbers in brackets indicate Mean SPI.

