Figure 4.
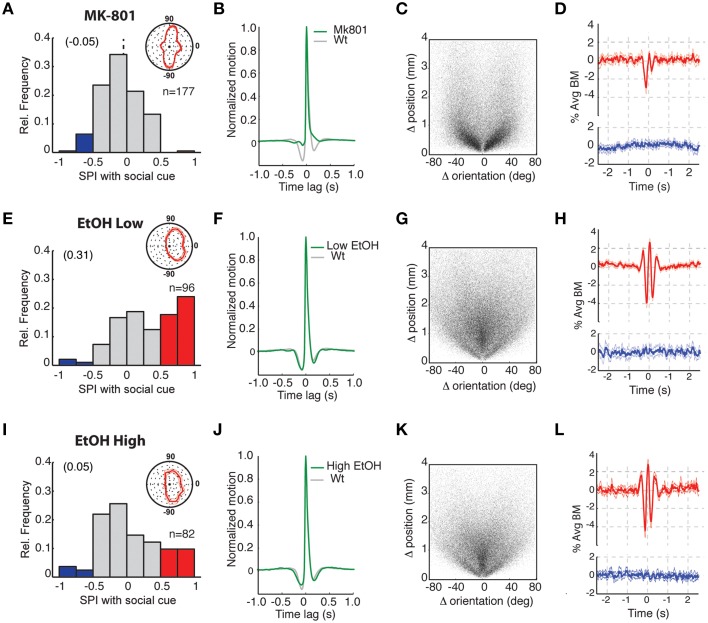
Exposure to NMDA receptor antagonist or ethanol disrupts social preference and differentially impairs social interactions. (A–D) Analysis of fish treated with 100 μM MK-801 NMDA receptor antagonist. (A) Histogram of SPIs revealing no apparent preference for the SC and (inset) body orientations showed little or no direction toward the SC chamber (zero position). SPIs during the acclimation periods are shown in Supplementary Figure 2D. (B) Average motion bout profile for MK-801 treated fish. Relative to untreated controls (gray plot), there is a reduction in the pre- and post-bout quiescent periods and consequently the periodicity of bout generation. (C) Scatter plot presentation of all bouts (n = 85.275 bouts) from all tested fish, where each bout is represented by single point based on the position and body orientation change that occurred for that bout. MK-801 treatment results in a conspicuous reduction in forward swimming bouts (“0” position on X-axis). (D) Bout-triggered averages (BTA) of MK-801-treated observer fish when the SC fish was visible (red plot) or not (blue plot). There is a disruption of normal movement interactions before and after 0 s offset (compare to equivalent plots in Figure 3 or in h and l below) and the abolishment of behavioral synchrony at 0 s offset (see results text for further explanation). (E–H) Comparable analyses as in (A–D) of fish treated with 0.125% alcohol. (E) Plot of SPIs showing that social preference (red) remains and (inset) body orientations were directed toward the SC chamber. (F–H) Average motion bout profiles (F), bout distributions (n = 101, 167 bouts) (G), and BTA plots (H) are all similar to untreated 3 weeks old zebrafish. (I–L) Comparable analyses as in (A–D) of fish treated with 0.5% alcohol. (I) Analysis of SPIs showing social preference is severely disrupted and (inset) body orientations are less strongly directed toward the SC chamber. (J–L) Average motion bout profiles (J), bout distributions (n = 69, 675 bouts) (K), and BTA plots (L) are all similar to untreated 3 weeks old zebrafish.

