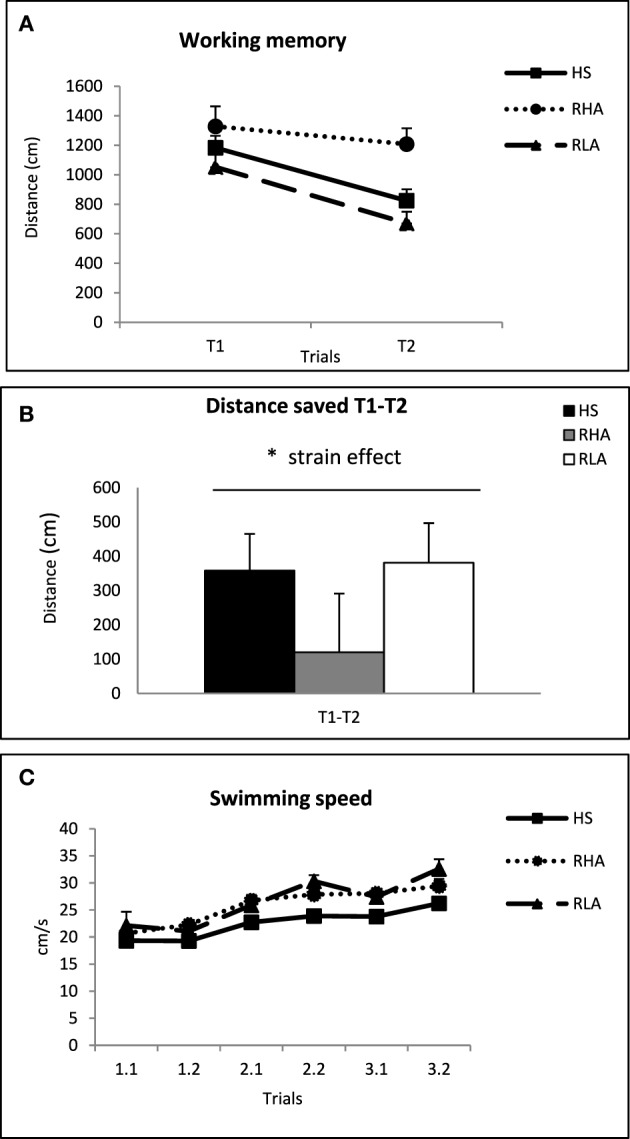
Figure 2.

(A) Mean ± S.E.M. of the distance (cm) traveled by the rats of the three strains in the first (T1) and second (T2) trials, averaged for the 3 days. (B) Mean ± S.E.M. of the three differences (i.e., subtractions T1-T2), corresponding to the 3 days, between the first (T1) and the second trials (T2) of the working memory task. (C) Mean ± S.E.M. swimming speed for each trial and strain. *p < 0.05, “Strain” effect (One-Way ANCOVA; see text).
