
Figure. Prevalence of Elevated Blood Pressure and Impaired Fasting Glucose Levels Based on Body Mass Index (BMI) Range.
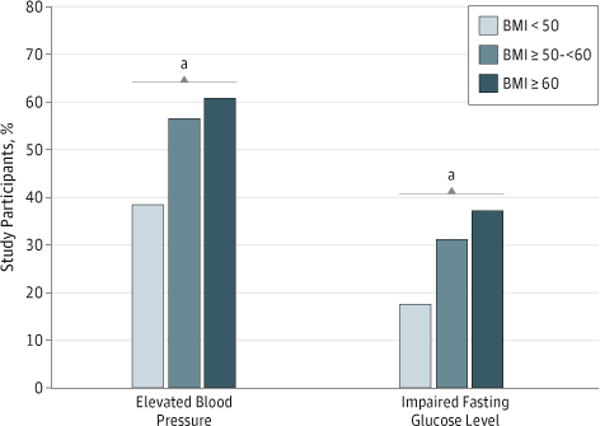
Body mass index is calculated as weight in kilograms divided by height in meters squared.
aA significant increasing linear trend across the 3 BMI groups. Both elevated blood pressure and the impaired fasting glucose level observed P < .01 when performing this test for trend.