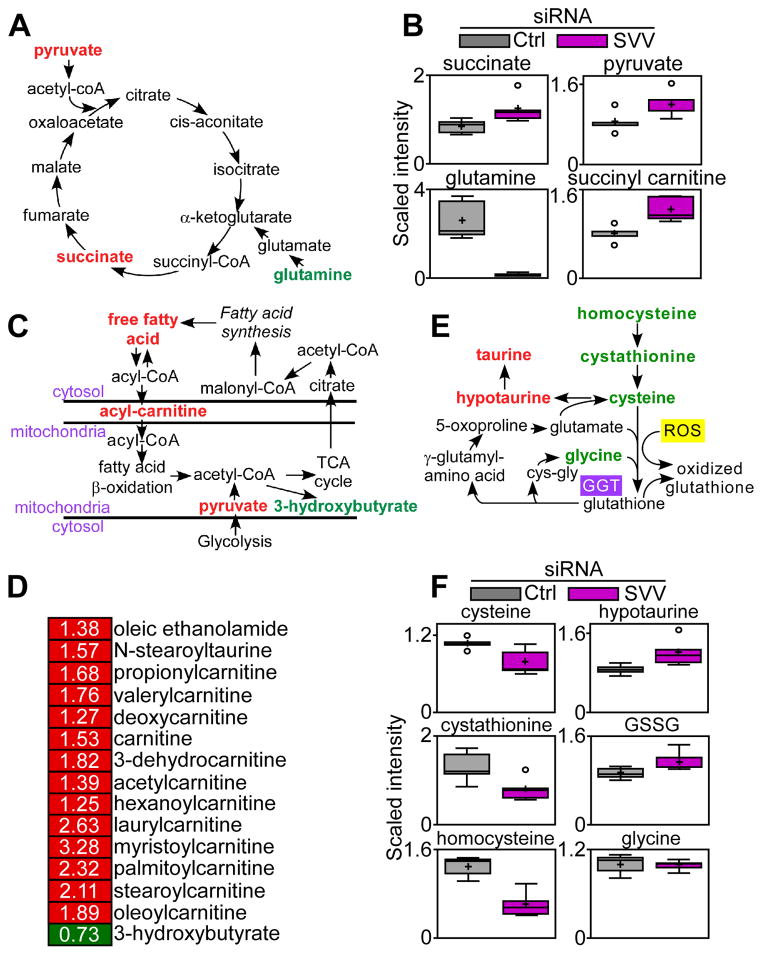
Fig. 1. Survivin targeting impairs mitochondrial metabolism.
(A–F) Global metabolomics screening of PC3 cells transfected with control or survivin-directed (SVV) siRNA (n=5 biological replicates; see also table S1). Changes in the concentrations of metabolites implicated in oxidative phosphorylation (A and B), fatty acid β oxidation (C and D), or glutathione metabolism (E and F) are shown. For the heatmap (D), red indicates increased concentration; green indicates decreased concentration. Only significant changes (p<0.05) are shown. For box plots (B and F), relative metabolite abundance is represented. The limit of upper and lower quartiles, median values (straight line), and maximum and minimum distribution are shown. Cross, mean value; circle, extreme data point.

