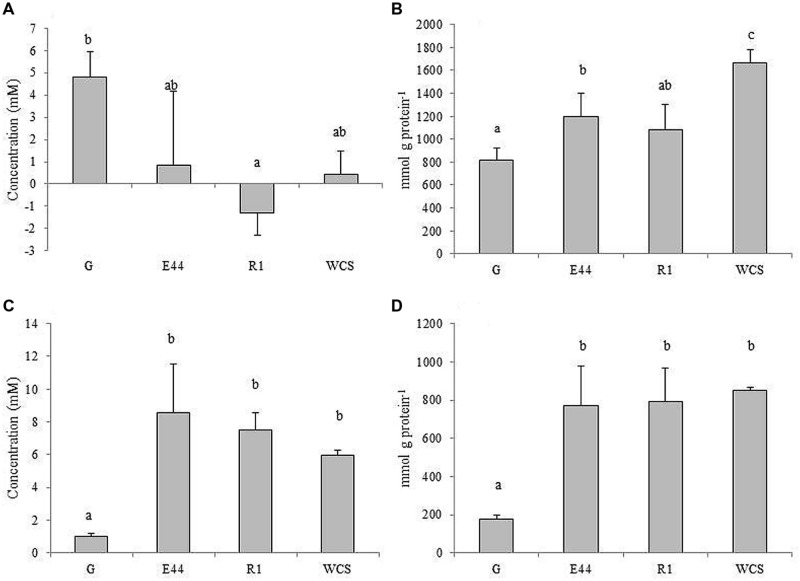
FIGURE 3.
Total amino acid concentrations in culture supernatants (A), and CFEs (B) along with ammonia levels in supernatants (C) and CFEs (D) of B. fragilis DSMZ2151 grown in glucose (G), EPS E44, EPS R1 and in medium without carbohydrate source (WCS). Different letters indicate significant differences among cultures with the different carbohydrates (P < 0.05). Error bars represent standard deviation.

