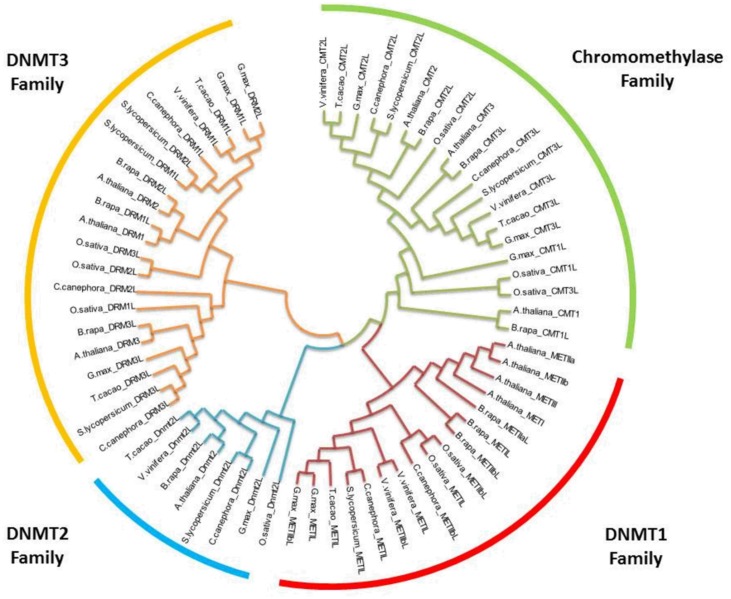
FIGURE 1.
Phylogenetic relationships of orthologous DNA (cytosine-5-)-MTases among various plants. The evolutionary history was inferred by using the maximum likelihood method based on the Tamura-Nei model (Tamura and Nei, 1993). Bootstrap analyses consisted of 500 replicates. The analysis involved 66 nucleotide sequences. All positions with less than 95% site coverage were eliminated. Evolutionary analyses were conducted in MEGA6 (Tamura et al., 2013). Oryza sativa was used as the outgroup.

