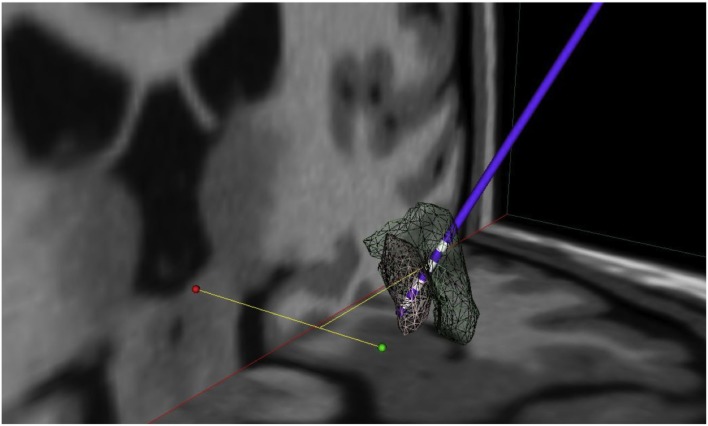
Figure 4.
Mean electrode localization. Visualization of mean coordinates of left and right hemisphere mirrored to the left; 3D space relative to AC-PC line (green dot: AC, red dot: PC), gray mash: GPI, green mash: GPE; lowermost contacts comprise GPI and uppermost contacts comprise GPE stimulation. Thus, mean chronic stimulation at 6-month follow-up projects mid-electrode to the border zone between GPE and GPI. For visualization the following atlas software was used: Medtronic DBS Neurosurgical Simulator, licensed 2008, Version 1.2.3, Medtronic Inc., Minneapolis, MN, USA.

