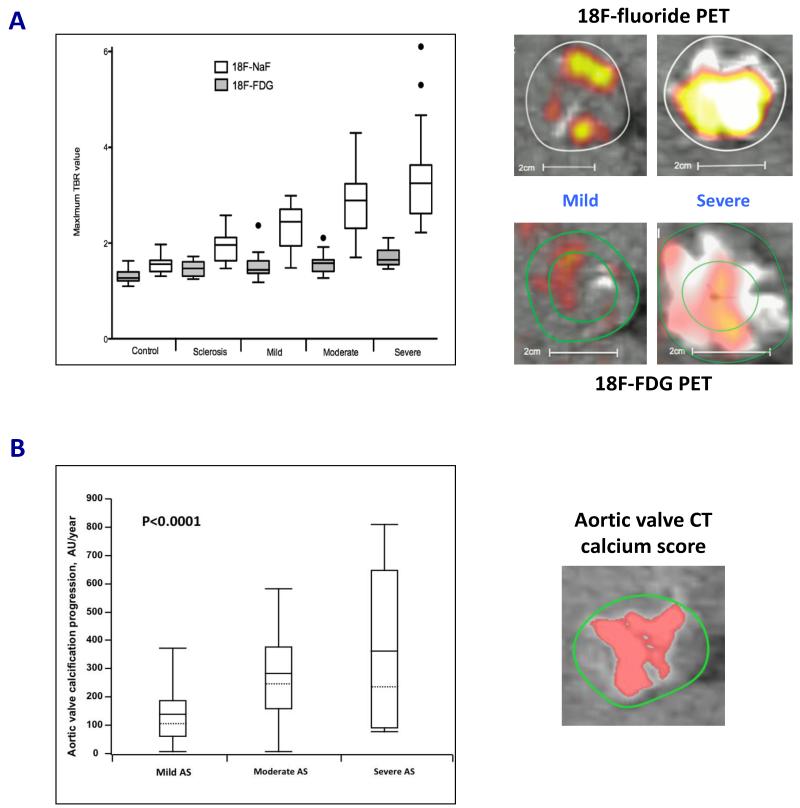
FIGURE 1.
(A) 18F-Fluoride (18F-NaF; a marker of novel calcification) activity increased markedly with severity of aortic stenosis. Conversely, 18F-fluorodeoxyglucose (18F-FDG; a marker of inflammation) activity had a more modest association with aortic stenosis severity. This supports the notion that calcification rather than inflammation predominates in the valve, particularly in the later stages of the disease. Fused positron emission tomography (PET)/computed tomography (CT) scans demonstrated a significant difference in tracer activity (top right panels: 18F-NaF and bottom right panels: 18F-FDG) on co-axial views of the aortic valves in patients with mild and severe aortic stenosis. White and yellow/red areas depict calcium deposits and PET tracer activity, respectively. Results presented in box and whiskers plot (Tukey): the central box represented the interquartile range of tissue-to-background ratios (TBR) with the median indicated by the dark line. The whiskers extended to the most extreme values within the 1.5 interquartile ranges. Adapted with permission from (31).
(B) Aortic valve calcification can be quantified accurately on CT (right panel). Consistent with PET data, the progression of aortic valve calcification on CT was associated with severity of aortic stenosis. Patients with severe aortic stenosis experienced increased progression of aortic valve calcification compared to those with mild or moderate disease. Results presented in box and whiskers plot: the central box represented the interquartile range, with the mean and median indicated by the dark and dotted lines, respectively. The whiskers indicated the 5th and 95th percentiles. Adapted with permission from (17).

