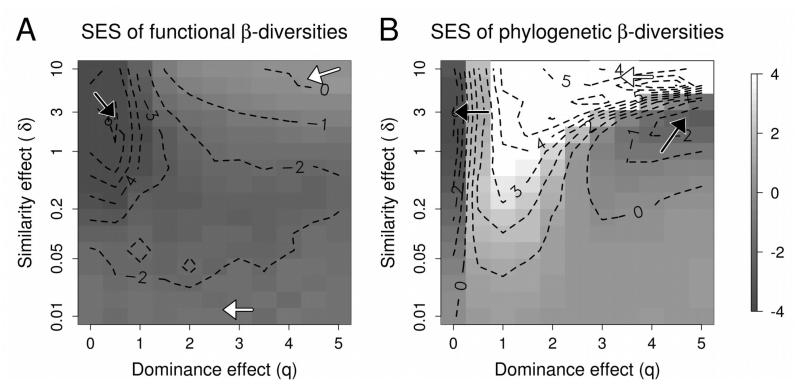
Figure 1.
Standard Effect Sizes (SES) of the functional (left panel) and phylogenetic (right panel) beta-diversity of the meta-community against a tip-shuffling null model, as a function of the strength of the dominance effect (q) and the strength of the similarity effect (δ). A low q value indicates that rare and dominant species were given about the same weight while a high q value indicates that more weight was given to dominant species. A low (respectively high) δ value indicates that small (respectively large) species’ similarities were given more weight (Figure 1). A low SES value indicates a higher than expected β-diversity, hence a predominant influence of environmental filtering, while a high SES value indicates a lower-than-expected β-diversity, hence a predominant influence of competition resulting in a limiting similarity pattern. Black and white arrows points towards respectively local minima and maxima.

