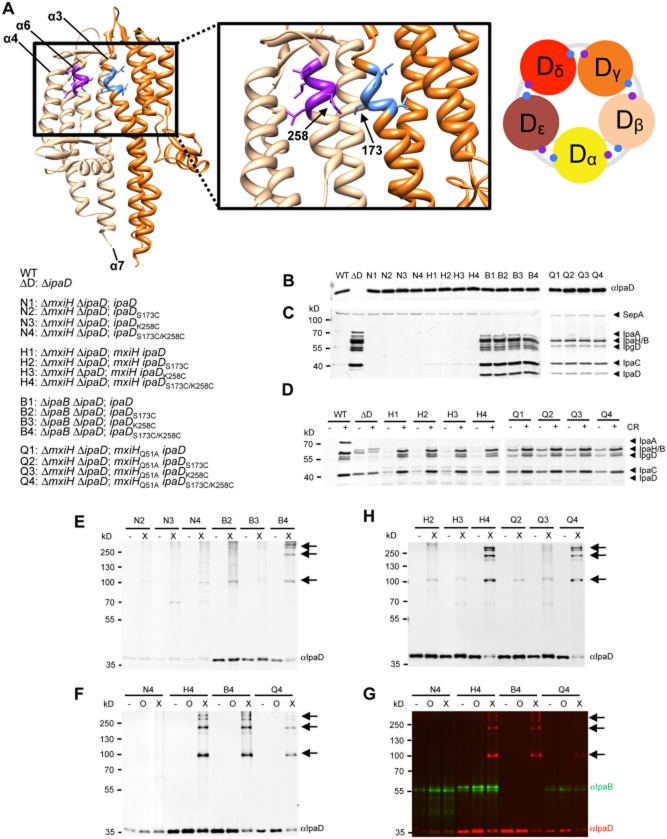
Fig. 2.
Analysis of the organisation of IpaD subunits within the TC by chemical crosslinking.A. Model of IpaD dimer (left; PDB ID 2j0n) and close up view (middle) displaying the regions V170 – L174 of helix α3 (blue) of one subunit and L257 – D261 of helix α6 (purple) of the second subunit used for cysteine mutagenesis. Right, schematic top view of TC atop the needle, identifying the predicted relative location of the mutations made. IpaD subunits are labelled from lighter to darker colours (i.e. yellow, pale orange, dark orange, red and maroon) and using alphabetically ordered Greek letters according their increasing height in the TC. Strains used for crosslinking were verified by analysing the expression level of IpaD via Western blot (B), the secretion of Ipa proteins from the supernatant (C) and after induction with Congo red (CR) (D) via silver staining. Crosslinking analysis of IpaD on the tip of the needles within crudely purified NCs (E–H) in the absence (−) or presence of crosslinker BM(PEG)2 (X) or oxidiser Na2S4O6 (O) via Western blot using antibodies against IpaD and IpaB. (G) Same Western blot as in F, exposed to show the anti-IpaB signal (green) together with the anti-IpaD one (red). All data shown are representative of at least 2 independent experiments. The strains used for these assays, and how they are symbolised in panels B–G, are listed to the left of panels B–D.

