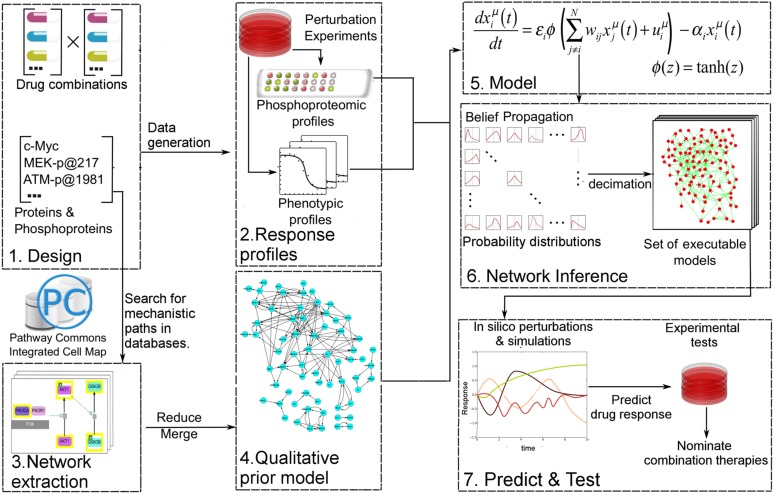
Figure 1. Quantitative and predictive signaling models are generated from experimental response profiles to perturbations.
Perturbation biology involves systematic perturbations of cells with combinations of targeted compounds (Box 1, 2), high-throughput measurements of responses (Box 2), automated extraction of prior signaling information from databases (Box 3, 4), construction of ordinary differential equation (ODE)-based signaling pathway models (Box 5 and Equation 1) with the belief propagation (BP) based network inference algorithm (Box 6), and prediction of system responses to novel perturbations with the models and simulations (Box 7) (Molinelli, Korkut, Wang et al., 2013). The newly developed ‘Pathway Extraction and Reduction Algorithm’ (PERA) (Box 3) generates a qualitative prior model (Box 4), which is a network of known interactions between the proteins of interest (i.e., profiled (phospho)proteins). This is achieved through a search in the Pathway Commons information resource, which integrates biological pathway information from multiple public databases. In the quantitative network models, the nodes represent measured levels of (phospho)proteins or cellular phenotypes, and the edges represent the influence of the upstream nodes on the time derivative of their downstream effectors. This definition corresponds to a simple yet efficient ODE-based mathematical description of models (Box 5). Our BP-based modeling approach combines information from the perturbation data (phosphoproteomic and phenotypic) with prior information to generate network models of signaling (Box 6). We execute the resulting ODE-based models to predict system response to untested perturbation conditions (Box 7).


