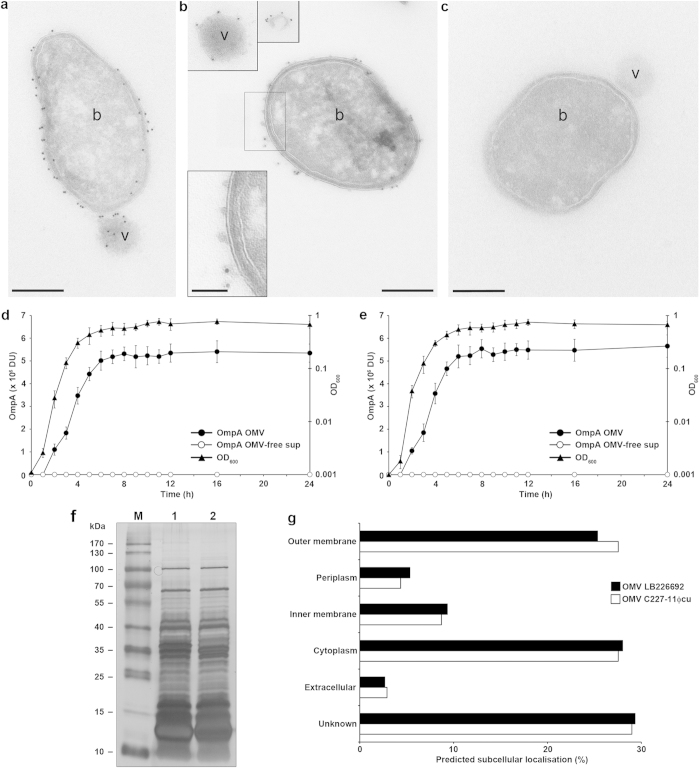
Figure 1. E. coli O104:H4 outbreak strain releases OMVs.
(a–c) Immunogold staining of ultrathin frozen sections of an overnight LB agar culture of strain LB226692 using (a,b) anti-E. coli O104 LPS antibody and Protein A Gold (10 nm gold particles) or (c) only Protein A Gold (control). The inset in panel (b) (bottom) shows magnification of the indicated region. Frames (top) delineate OMVs that were located at longer distances from the OMV-producing bacteria and were thus detected in different microscopic fields. Examples of bacterial cells (b) and OMVs (v) are indicated. Scale bars are 300 nm, in the inset in panel (b) 100 nm. The images were acquired with a FEI-Tecnai 12 electron microscope. (d,e) Kinetics of OMV production. Strains LB226692 (d) and C227-11Φcu (e) were grown in LB broth, OMVs were isolated at indicated time points and analysed using immunoblotting with anti-OmpA antibody. Signals were visualised with Chemi Doc XRS imager, quantified using Quantity One® software, and expressed in arbitrary densitometric units (DU). OMV-free supernatants served as controls. Bacterial growth was monitored by measuring OD600. Data are means ± standard deviations from three independent experiments. (f) Protein profiles of LB226692 (lane 1) and C227-11Φcu (lane 2) OMVs determined by SDS-PAGE and silver staining. M, Marker IV (Peqlab Biotechnologie); the sizes of the bands are shown on the left side. (g) Distribution of OMV-associated proteins identified using nano-LC-MS/MS according to their subcellular localisation as determined by PsortB prediction tool.

