
Figure 2. OMVs from E. coli O104:H4 outbreak strain contain a cocktail of virulence factors.
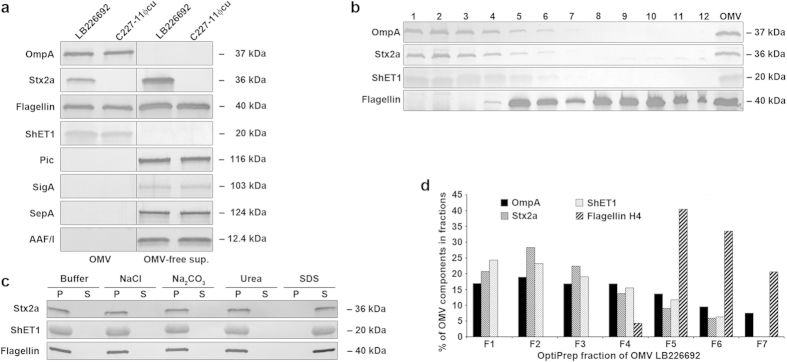
(a) Distribution of virulence factors of the outbreak strain in OMVs and OMV-free supernatants. OMVs and OMV-free supernatants from strains LB226692 and C227-11Φcu were analysed by immunoblot with antibodies against OmpA (an OMV marker) and the indicated virulence proteins (signals obtained from OMVs and OMV-free supernatants tested on the same membrane are separated by a vertical line). (b) Distribution of Stx2a, ShET1 and H4 flagellin in OptiPrep density gradient fractions of OMVs LB226692 demonstrated by immunoblot. The numbers above the blots (from left to right) indicate the order of the fractions in which they were collected from top to bottom of ultracentrifugation tubes. The lanes designated OMV contain non-fractionated OMVs (positive control). (c) Dissociation assay. Pools of LB226692 OMV OptiPrep fractions 1 to 6 and 4 to 7, respectively, were incubated in HEPES buffer alone (control), or in HEPES buffer with the indicated chemicals. After ultracentrifugation, pellets (P; containing OMVs) and supernatants (S; containing proteins released from OMVs) were immunoblotted with anti-Stx2a or anti-ShET1 (pool of fractions 1 to 6) or anti-H4 (pool of fractions 4 to 7) antibodies. Signals in panels (a–c) were visualised with Chemi Doc XRS imager, and quantified (in panels (a,b)) using Quantity One® software. Sizes of immunoreactive bands are shown on the right side (for Stx2a, ShET1, and AAF/I the size of the A subunit is provided). Crops of representative immunoblots are shown. Full immunoblots are shown in Supplementary Figures S5, S6, and S7. (d) Percentual distribution of OmpA, Stx2a, ShET1 and H4 flagellin in OptiPrep gradient fractions 1 to 7 as demonstrated by densitometric quantification of immunoblot signals shown in panel (b) using Quantity One® (the sum of signals of each virulence factor in fractions 1 to 7 was considered 100%).