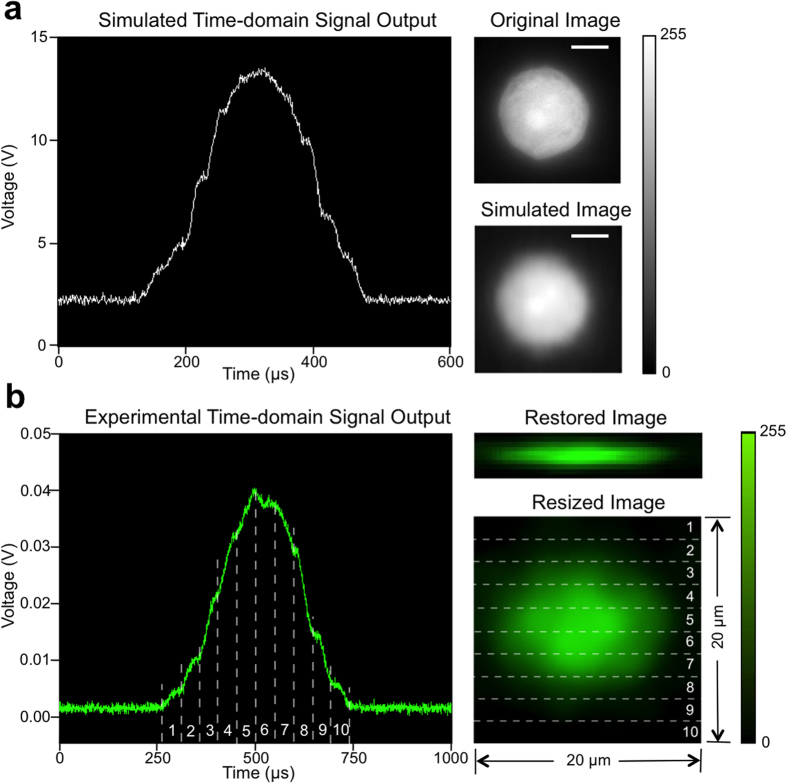
Figure 2. Illustration of restoring cell images from PMT signals.
(a) Simulation result: result of time-domain light intensity signal from simulation, original cell image used as input for simulation, and corresponding restored image. Scale bar is 5 μm. (b) Experimental result: time-domain PMT output signal of fluorescent light from a A549 cell stained with CellTrace CFSE, corresponding original fluorescence image restored by algorithm, and corresponding resized fluorescence image to show the real size of the cell. The numbered regions segmented by dashed lines demonstrate the correspondence between the time-domain signal and the resulting image. Size is labeled in figure.

