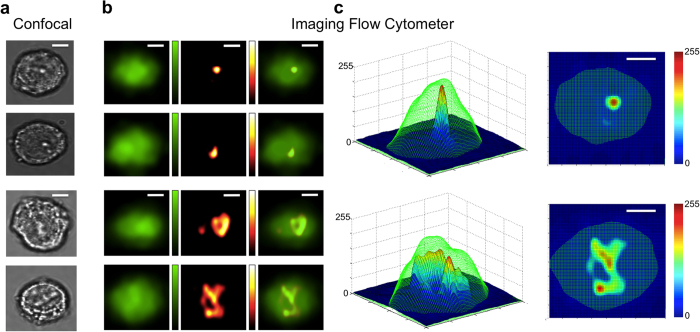
Figure 4. Backscattering and fluorescent cell images from spatial filter based imaging flow cytometry.
All images are of A549 human lung adenocarcinoma epithelial cells, stained with CellTrace CFSE, flowing at a velocity of 0.2 m/s. (a) Representative confocal images of G1 (top two) and G2/M (bottom two) arrested cells. (b) Representative imaging flow cytometer images of G1 (top two rows) and G2/M (bottom two rows) arrested cells. Fluorescence images are shown in left column, backscattering images are shown in middle column, and overlay images are shown in right column. Green colorbar representing intensity from 0 to 255 is applied for fluorescence images. Hot colorbar representing intensity from 0 to 255 is applied for backscattering images. (c) 3-dimensional plots for overlay of fluorescence (green mesh) and backscattering (jet surface) images of G1 (top) and G2/M (bottom) arrested cells. Jet colorbar representing intensity from 0 to 255 is shown. Size of all image crops is 20 μm by 20 μm; all scale bars are 5 μm.

