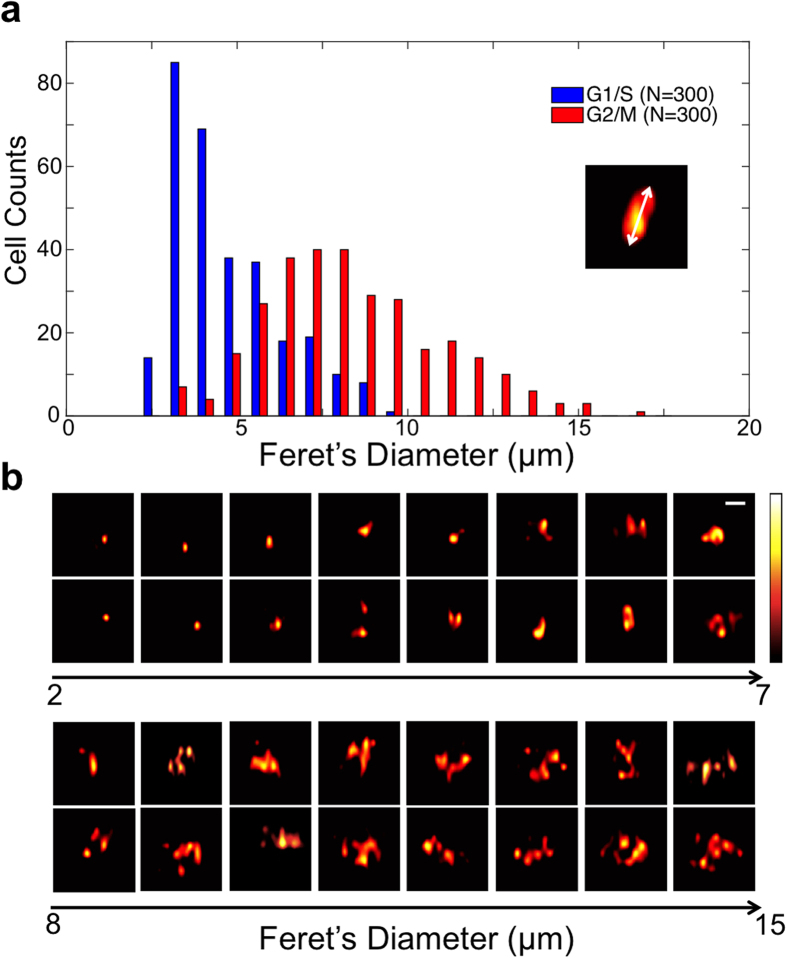
Figure 5. Differences of the backscattering images of cell arrested at G1 phase and G2/M phase.
All images are of A549 cells flowing at a velocity of 0.2 m/s. (a) Histogram of the Feret’s diameters of the G1 (blue bar) and G2/M (red bar) arrested cells’ backscattering images. 300 cell images from each group are measured. The sketch shows the definition of the Feret’s diameter: the longest distance between any two points along the object’s boundary, also known as maximum caliper. (b) Two example backscattering images for each bin in the histogram. Hot colorbar represents intensity from 0 to 255. Sizes of all cell backscattering images are 20 μm by 20 μm; the scale bars is 5 μm.

