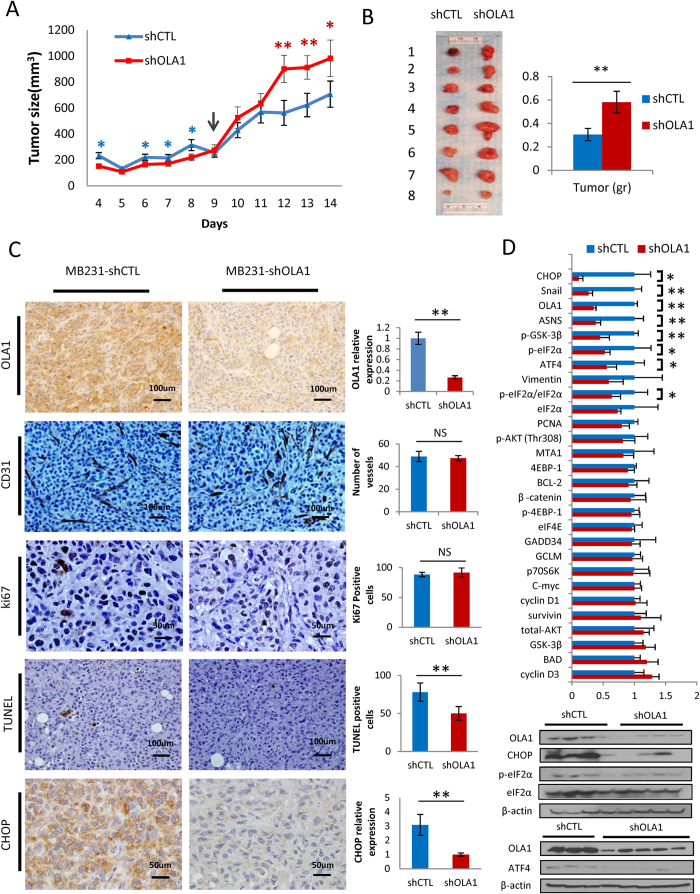
Figure 5. The effect of OLA1-KD on tumor growth in xenograft breast cancer models.
(A) Growth curves of xenograft by inoculation of MDA-MB-231-derived (Approach 1) C2B (shCTL) cells into left and 56E (shOLA1) cells into right shoulder of the same nude mouse. Note that in early days the shOLA1 tumors were smaller (blue *), and after a “turning point” (arrow), bigger than the shCTL tumors (red *) (n = 8). (B) Photograph of the harvested tumors (left) and the weight of these tumors (right) (n = 8). (C) IHC analysis of tumor tissues harvested from an orthotopic breast cancer model (Approach 2, SCID mice). Representative microscopic images are shown for staining of OLA1 (cytosol), CD31 (vascular endothelium), Ki67 (nuclei), TUNEL (nuclei), and CHOP (cytosol). Quantitative analyses of each staining are shown as bar graphs on the right. At least 5 fields per slide and 3 slides per animal group were counted at 200× magnification. (D) IB analysis of tumor tissues harvested from the orthotopic breast cancer model (Approach 2, SCID). Levels of proteins and protein phosphorylation were quantified by ImageJ. The bar graphs (top) represent relative expression of each protein with mean values from the shCTL group set as 1.0 (n ≥ 3). IB (bottom) comparing the eIF2α-ATF4-CHOP pathway in shCTL and shOLA1 tumors. See also Figure S6 for all other IBs quantified in the bar graphs. Error bars: SEM, Student’s t test: *p < 0.05; **p < 0.01; NS, not significant. Cropped blots are used. Full scan images of immunoblots are presented in Figure S13.

