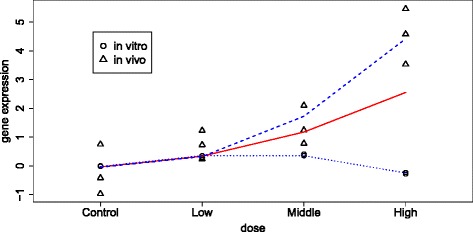
Fig. 3.

Projected fractional polynomial framework example: Using gene A2m and compound sulindac. Illustration of a projected fractional polynomial model from one system to the other. Red solid line shows the projected fractional polynomial model. The blue lines shows the results of fitting fractional polynomial models with different parameters for in vitro (dotted line) and in vivo data (dashed line), respectively
