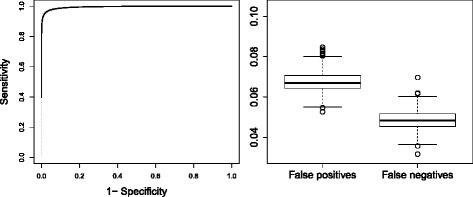
Fig. 6.

Validation of fractional polynomials: Results of simulation study. Left panel: ROC curves for sensitivity and specificity of all simulated data set (grey dotted lines) and averaged ROC curve (black solid line). Right panel: Box plot of false positives and false negatives of all 1,000 simulated data sets
