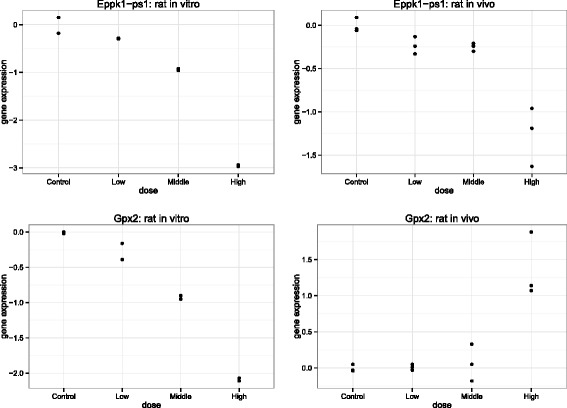
Fig. 7.

Group 1 example: compound sulindac. Two genes from Group 1. Top panels: gene Eppk1-ps1 with the same direction of dose-response relationships, but different magnitude of fold change. Bottom panels: gene Gpx2 with different direction of dose-response relationships across platforms. Left panels: in vitro. Right panels: in vivo
