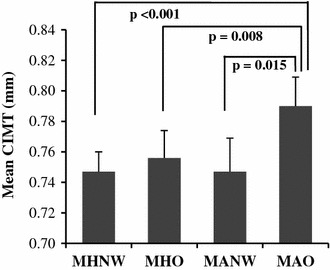
Fig. 1.

Carotid intima-media thickness according to obesity subtypes. Data are expressed as mean ± standard deviation. Only significant p values in CIMT differences among groups are presented. CIMT carotid intima-media thickness, MHNW metabolically healthy normal weight, MHO metabolically healthy, but obese, MANW metabolically abnormal, but normal weight, MAO metabolically abnormal obese
