
Fig. 2.
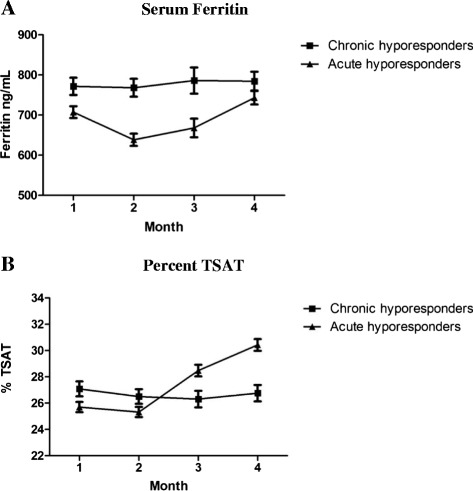
Iron storage indices are illustrated for acute and chronic ESA hyporesponsive patients over months 1 (baseline) through 4. Mean serum ferritin concentrations are shown in panel a (log transformed values of asymmetrically distributed ferritin values among patients). Mean percent TSAT are shown in panel b