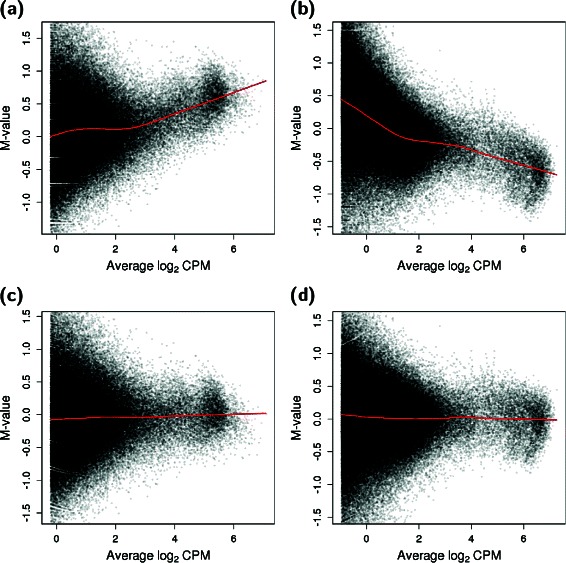
Fig. 3.

Trended biases with respect to the average abundance for real Hi-C data. Each point represents a 1 Mbp bin pair that is retained after filtering, with a loess trend (red) fitted across all points. The M-value is defined as the library size-adjusted log2-fold change between replicates for the ERG-treated cells in the Rickman et al. study [5] (a, c) or the ESCs in the Dixon et al. study [4] (b, d). Trends are shown before (a, b) and after (c, d) non-linear normalization in diffHic
