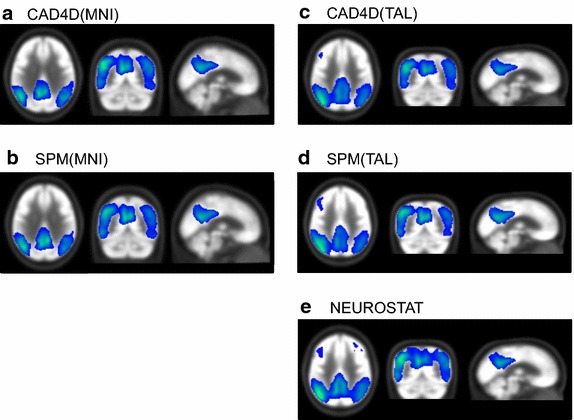
Fig. 5.

Results of SPM two sample t tests between the 37 reference datasets and 20 FDG-PET of AD patients. Images were spatially normalized images to the MNI space [a CAD4D(MNI), b SPM(MNI)], or to the Talairach space [c CAD4D(TAL), d SPM(TAL), e NEUROSTAT). For illustrative purposes, threshold t-maps (p < 0.001) were superimposed on FDG template. We used the same scaling for all t-maps shown (see also Table 2 for details)
