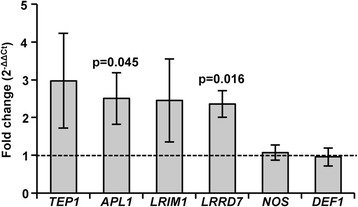
Fig. 8.

Mitochondrial ROS induced expression of A. stephensi immune genes. Graph represents means ± SEMs of fold change in the expression of selected immune genes in RNA samples prepared from 30 pooled midguts of mosquitoes fed a blood meal containing 1 μM rotenone relative to mosquitoes fed an unsupplemented blood meal (dotted line) at 6 h post-feeding. Data were analysed by Student’s t-test, significant p-values are shown, n = 3
