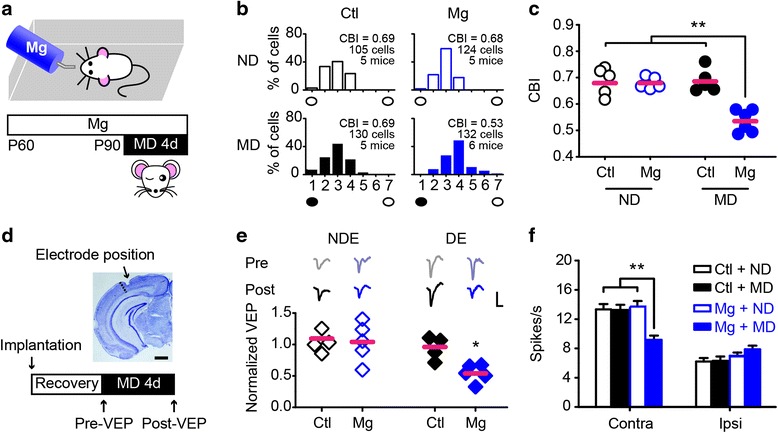
Fig. 1.

Restoration of juvenile forms of visual plasticity in adult mice following magnesium treatment. a Schematic of the experimental procedure. b OD distribution for adult control (Ctl, left column) and magnesium-treated (Mg, right column) mice with (MD) or without (ND) monocular deprivation. The number of cells and animals per group is as indicated. Filled black circles represent the deprived eye, and open black circles represent the non-deprived eye. c A summary of the CBIs of each group shown in (b). d The position of the implanted microelectrode and a schematic of the experimental procedure. The dashed line represents the border between V1 and V2. Scale bar, 1 mm. e (top) Representative traces showing the VEPs of each eye recorded before (Pre) or after (Post) 4 days of MD. Scale bars, 100 μV and 100 ms. (bottom) Summary of the effects on the responsiveness in each eye induced by MD. The post-VEP amplitude was normalized to the pre-VEP amplitude of the identical eye. DE, deprived eye; NDE, non-deprived eye. *P = 0.03 using paired Student’s t test. f Stimulation-evoked firing rates for each eye in groups shown in (b). Contra, contralateral eye; Ipsi, ipsilateral eye. Error bars, SEM. In c, e, the horizontal bar represents the mean value; each symbol represents one animal. In e, f, **P < 0.01 using a one-way ANOVA followed by Tukey’s post hoc test
