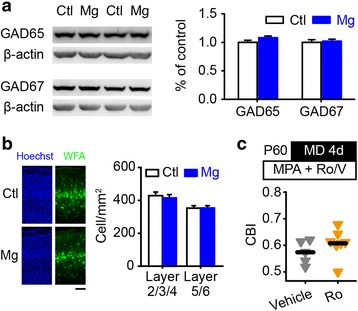
Fig. 3.

The distinct mechanism underlying the restoration induced by magnesium or reduced cortical inhibition. a The protein expression levels of GAD65 (Ctl, 17 mice; Mg, 15 mice) and GAD67 (Ctl, 12 mice; Mg, 11 mice) in V1b of control and magnesium-treated mice. Using two-tailed Student’s t test, P = 0.13 for GAD65, P = 0.73 for GAD67. b The density of cells surrounded by WFA-positive nets (green) in layers 2/3/4 and layers 5/6 of V1b in control (6 mice) and magnesium-treated (6 mice) mice. The DNA-binding dye Hoechst 33342 (Hoechst, blue) was used to identify the different layers. Scale bar, 100 μm. Using two-tailed Student’s t test, P = 0.65 for layers 2/3/4, P = 0.92 for layers 5/6. c Schematic of the experimental procedure (top) and a summary of the CBIs in adult MPA-treated mice with (Ro25-6981, Ro) or without (Vehicle, V) NR2B antagonist administration (bottom). The drugs were locally infused using an osmotic minipump one day prior to and concurrent with 4 days of MD. The horizontal bar represents the mean value; each symbol represents one animal. P = 0.26 using two-tailed Student’s t test. Error bar, SEM
