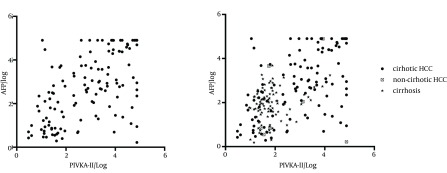
Figure 3. Scatter Plot for AFP and PIVKA-II. PIVKA-II was Measured in mAU/mL and AFP in ng/mL.

A, Scatter plot for all HCC patients; Level of PIVKA-II was independent from level of AFP; B, Scatter plot for all patients with HCC (red) and cirrhosis (blue).
