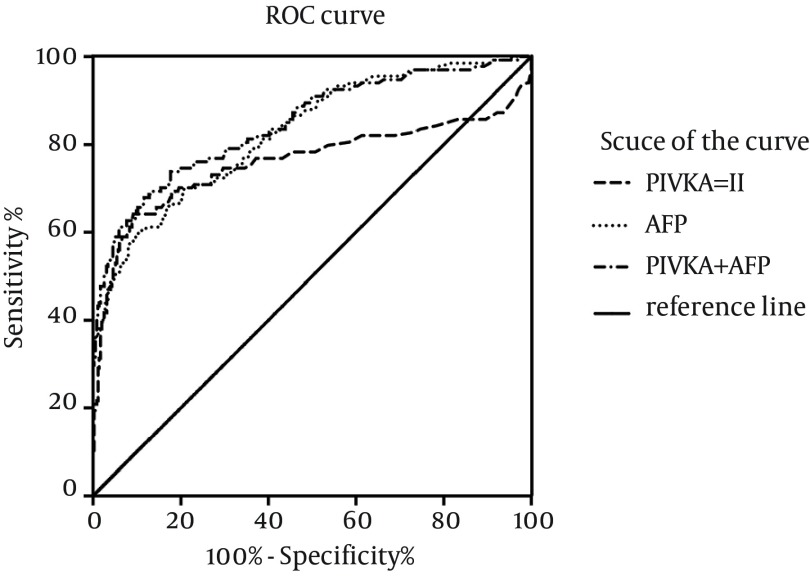
Figure 4. ROC Curve Evaluating Patients With HCC (n = 134) and Liver Diseases (n = 347).
The area under the ROC curve was shown with its 95% confidence intervals. AFP and PIVKA-II combined showed better performance than alone. The curves showed that the optimal cut-off value for PIVKA-II was 200.0 mAU/mL and that for AFP was 195.2 ng/mL. At the level of recommended cut-off values (40 mAU/mL for PIVKA-II and 20 ng/mL for AFP), the combination of the two markers had a sensitivity, specificity and Youden index of 86.6%, 53.0% and 0.396, respectively. And at the level of our new cut-off values, they were 73.1%, 83.3% and 0.564, respectively.

