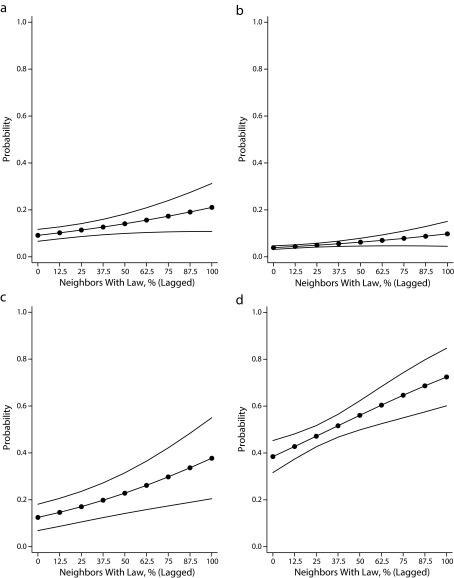
FIGURE 2—
Predicted probabilities and 95% confidence intervals of impaired driving laws at (a) first adoption with no prior alcohol laws, (b) first adoption with ≥ 1 prior alcohol law, (c) subsequent adoption with < 2 prior impaired driving laws, and (d) subsequent adoption with ≥ 2 prior impaired driving laws: United States, 1980–2010.

