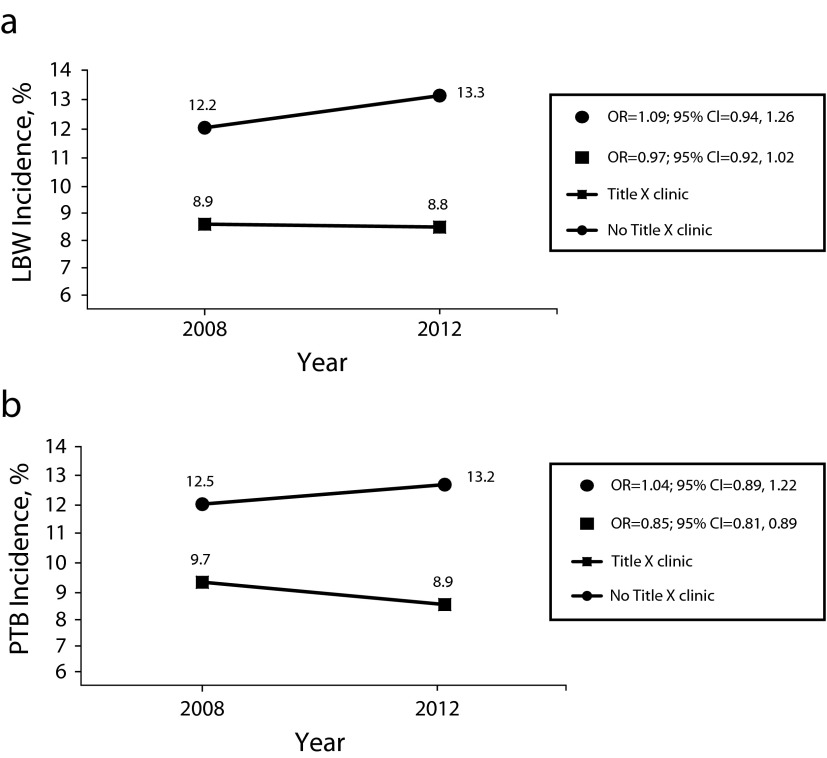
FIGURE 2—
Risk, according to year and residence in a county with a Title X clinic, of (a) low birth weight and (b) preterm birth: Colorado, 2008 and 2012.
Note. CI = confidence interval; LBW = low birth weight; OR = odds ratio; PTB = preterm birth. Estimates obtained from crude incidence of low birth weight and preterm birth according to year (2008 or 2012) and residence in a county with and without a Title X clinic. Odds ratios obtained from logistic regression models, adjusted for maternal age, race/ethnicity, body mass index (weight in kilograms divided by the square of height in meters), education, income, marital status, prenatal care, smoking status, history of gonorrhea, history of chlamydia, history of congenital anomaly, and interpregnancy interval. Estimates with the 95% confidence intervals are shown. For low birth weight, the interaction P = .15; for preterm birth, P = .017.

